
Plan the investigation
What students will do
Start with a guided comparison, then plan an investigation, analyze a graph, and check a prediction.
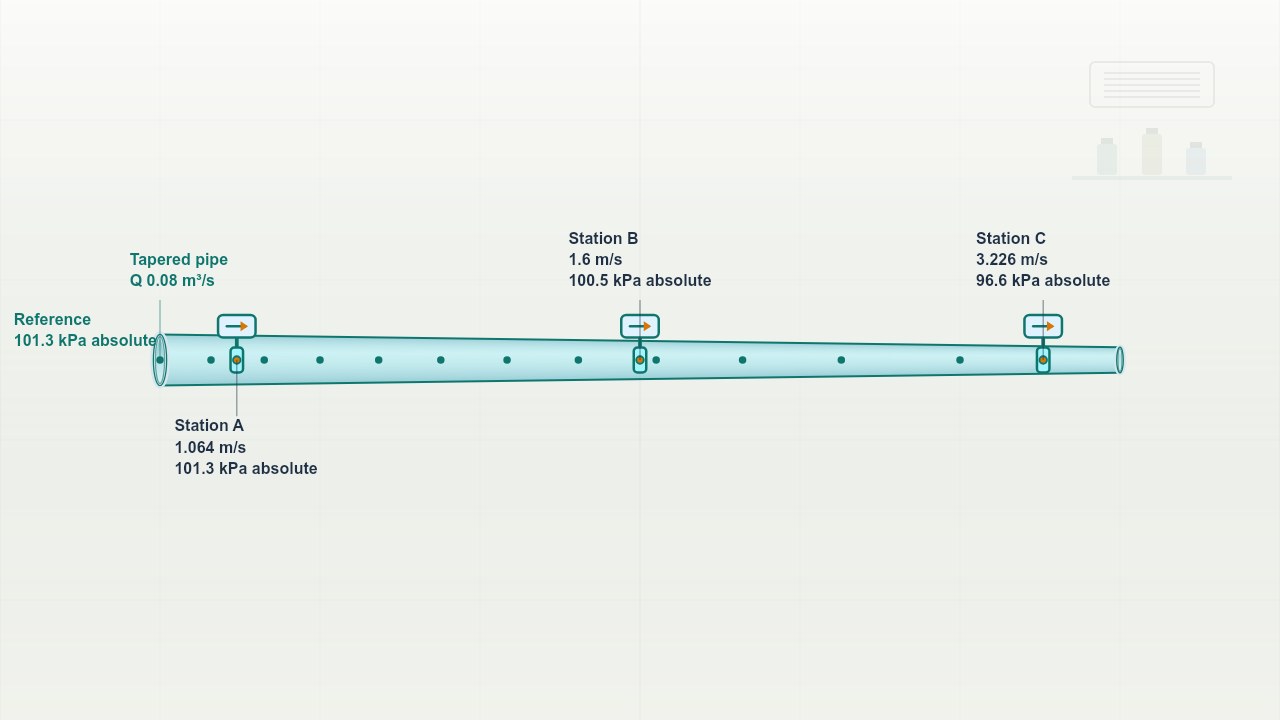
- Compare equal-time deliveries. Change outlet area while keeping volume flow rate fixed. Compare area, speed, and the volume delivered during the same time.
- Design and collect. Choose at least five station positions along the fixed taper. Measure local area and speed while source flow remains unchanged.
- Linearize the data. Transform area and speed to form a straight line. Use the best-fit slope to determine volume flow rate.
- Explain and predict. Connect volume flow with delivered volume, then predict and check local speed at an unused station position.
What students will learn
- Distinguish local speed from volume flow rate.
- Compare equal-time delivered volumes in steady unbranched flow.
- Infer volume flow rate from a graph and test a speed prediction.
Common misconception
Does the narrower section deliver less liquid each second?
Students compare local speed with volume delivered during equal time intervals.