
Plan the investigation
What students will do
Start with a guided comparison, then plan an investigation, analyze a graph, and check a prediction.
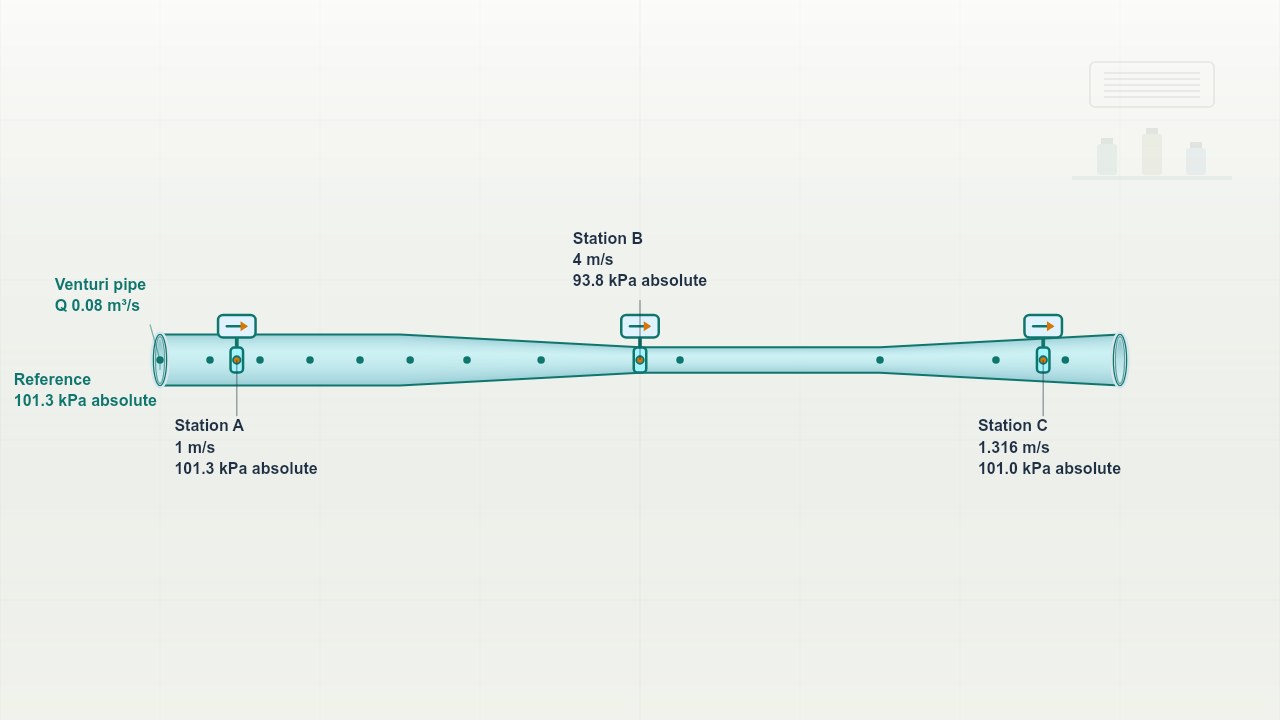
- Compare pipe stations. Measure area, speed, and absolute pressure at the inlet, throat, and outlet while the flow is steady.
- Design and collect. Choose at least five throat areas. Keep flow rate and station positions fixed and record throat pressure and speed.
- Linearize the results. Transform pressure and speed data to form a straight line. Determine liquid density and interpret the intercept.
- Explain and predict. Use the energy and continuity models to predict pressure for an unused throat area, then set it and check.
What students will learn
- Connect changes in pipe area, flow speed, and static pressure.
- Apply continuity and Bernoulli’s equation to horizontal flow.
- Determine liquid density from a graph and test a pressure prediction.
Common misconception
Must faster flow have greater static pressure?
Students compare measured pressures with speeds under the same ideal horizontal-flow conditions.