
Plan the investigation
What students will do
Start with a guided comparison, then plan an investigation, analyze a graph, and check a prediction.
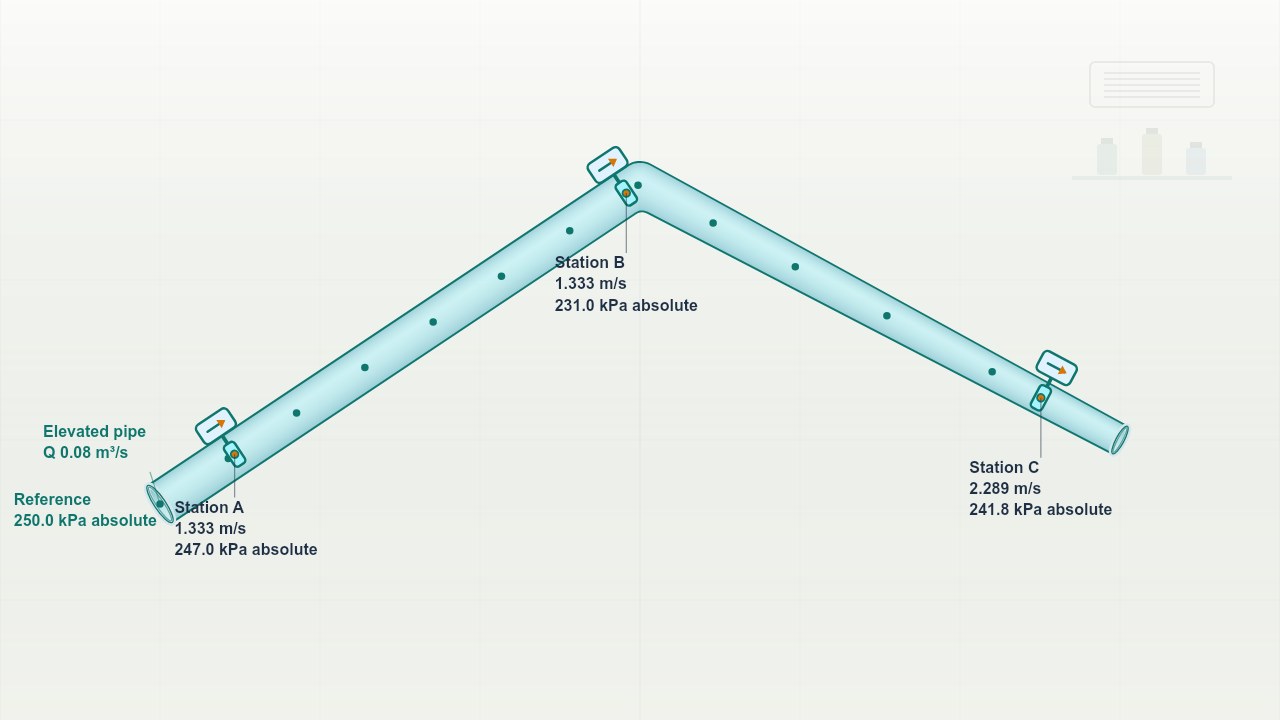
- Compare heights and speeds. Measure height, speed, and absolute pressure at three fixed stations along the elevated pipe.
- Design and collect. Choose at least five flow rates with pipe geometry and reference pressure fixed. Measure pressures and speeds at the same two stations.
- Linearize the comparison. Choose graph quantities that account for the height difference as well as speed changes. Infer liquid density from the fitted slope.
- Explain and predict. Evaluate how both energy terms affect pressure, then predict and test the downstream pressure at an unused flow rate.
What students will learn
- Account for height and speed in a pressure comparison.
- Keep station positions and pressure references consistent.
- Infer liquid density and test Bernoulli’s equation with a new flow rate.
Common misconception
Does height difference explain all of the pressure change?
Students vary flow rate to distinguish the effects of speed and height in Bernoulli’s relationship.