Translate between graphs
Use velocity–time slopes to identify acceleration and position–time slopes to identify velocity. Explain what happens when a graph crosses zero.
 BuildPhysics
AP Physics 1 · Unit 1 · Kinematics
Connect position, velocity, and acceleration graphs for the same trip. Interpret turning points, areas, delayed starts, and catch-up motion through six conceptual and six calculation questions.
12 questions6 conceptual · 6 calculation
Start practiceFree · No account required · Self-paced
 Open interactive practice
What you’ll practice
Use velocity–time slopes to identify acceleration and position–time slopes to identify velocity. Explain what happens when a graph crosses zero.
Find displacement from velocity–time area and velocity changes from acceleration–time area. Separate positive and negative regions.
Combine acceleration, cruising, braking, and waiting. Compare two carts using a shared time origin to decide when they meet.
A question from this set
Which description matches this velocity–time graph over the entire interval?
Try it in the practice setKey ideas
At a turning point, velocity passes through zero while acceleration may stay nonzero. A position curve then changes from increasing to decreasing, or the reverse.
Regions above and below zero contribute with opposite signs to displacement on a velocity graph. Total distance instead adds the magnitudes of the traveled segments.
See the physics
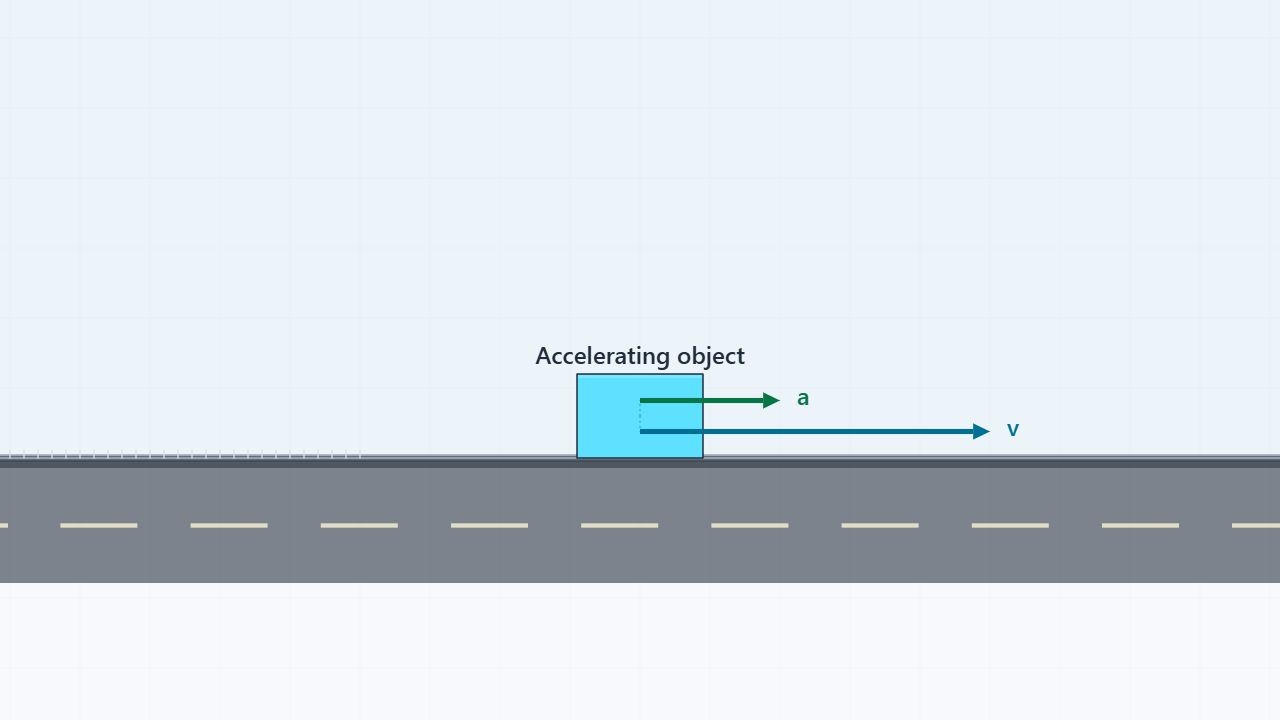
After checking your response, run the cart and compare its position, velocity, and acceleration views. Delayed-start and chase questions use parallel lanes so the two motions can be compared on one clock.
Use a hint for a starting point or open a worked solution to follow the reasoning. Your progress saves in this browser, so you can return to unfinished questions.
Begin with a conceptual question, then work through the calculations.