Measure acceleration
Use velocity–time slope to describe how quickly velocity changes.
 BuildPhysics
AP Physics 1 · Unit 1 · Kinematics
Translate between position, velocity, and acceleration graphs. Use motion evidence to explain slopes, signed areas, and direction changes.
Start lesson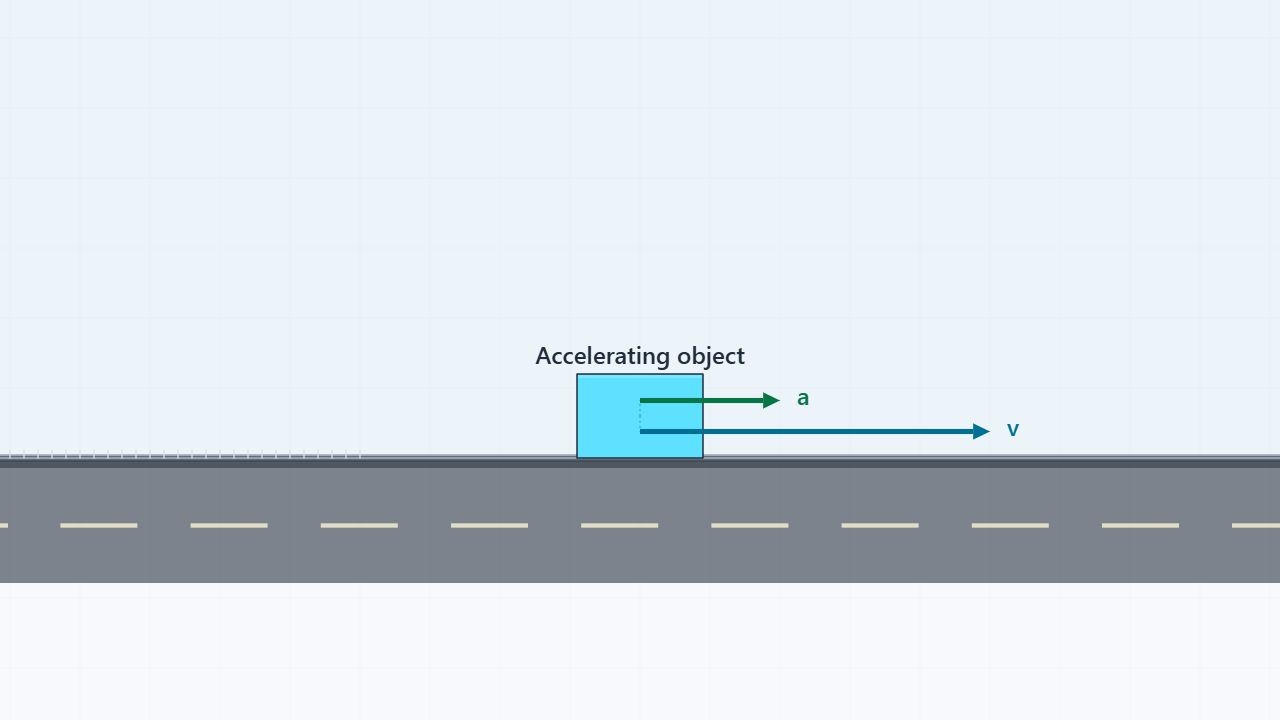 Start guided lesson
Learn by doing
Use velocity–time slope to describe how quickly velocity changes.
Distinguish the velocity change from acceleration–time area and displacement from velocity–time area.
Compare graphs across successive motion segments, including a reversal.
The big idea
Position–time slope gives velocity; velocity–time slope gives acceleration. A graph’s height and slope describe different quantities.
Acceleration–time area gives Δv, so add the initial velocity to find final velocity. Velocity–time area gives Δx.
A quick comparison
An acceleration of +2 m/s² acts for 3 s.
Velocity change +6 m/sFinal velocity also needs vi
The first scene is set up. Start the lesson and explore.