
Plan the investigation
What students will do
Start with a guided comparison, then plan an investigation, analyze a graph, and check a prediction.
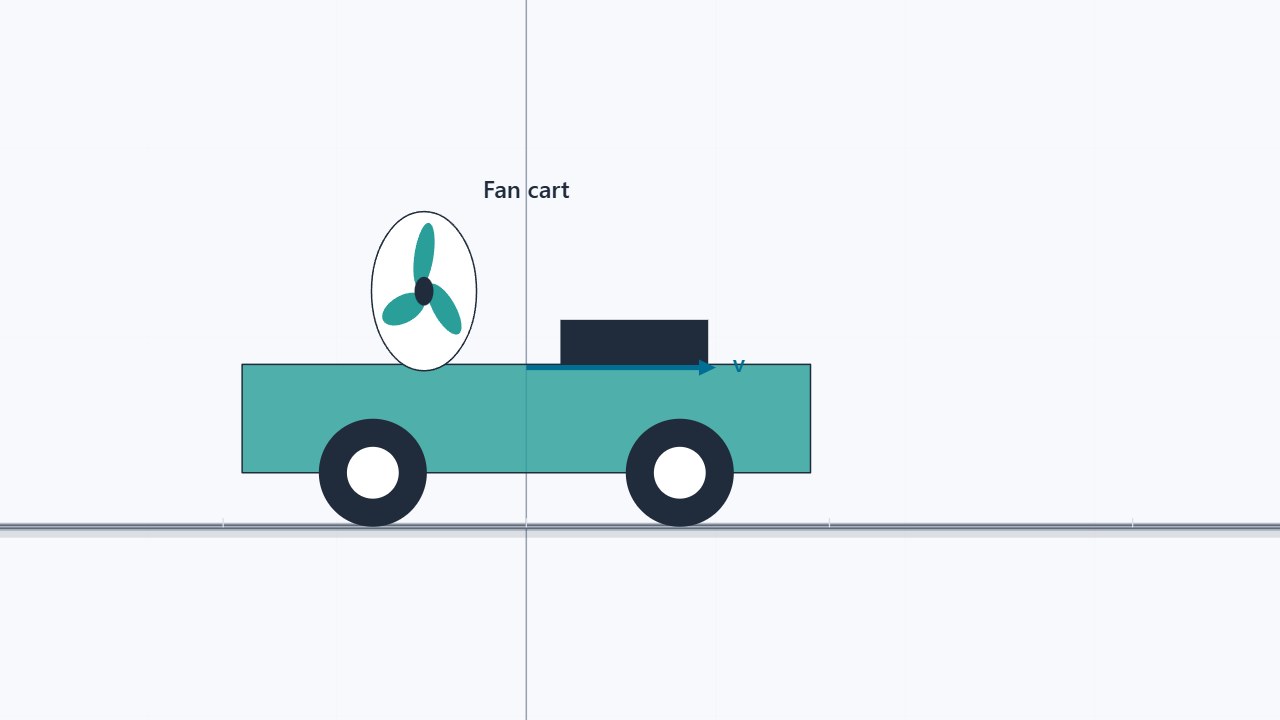
- Compare three pushes. Compare two rightward pushes, then reverse the fan. Use the motion graphs and the impulse up to the turnaround to explain why the cart stops.
- Plan a set of trials. Choose four peak fan forces, including rightward and leftward pushes. Measure the area under the curve and the velocities on either side of each pulse.
- Test the model. Plot measured impulse against velocity change. Use the slope to estimate the mass and check whether the line supports the impulse–momentum relationship.
- Predict another run. Use the fitted line and an unused peak force to predict the final velocity. Run the cart and check the prediction.
What students will learn
- Connect a cart’s turnaround on position and velocity graphs with the impulse needed to stop it.
- Compare the area under the curve on a force–time graph with momentum change.
- Use measured data to test a model and predict a new velocity.
Common misconception
Does a smaller peak force always mean a smaller velocity change?
Compare the area under the curve for a brief strong push and a longer gentle push. Apply the same reasoning to stopping the cart.