
Plan the investigation
Same impulse, different force profiles
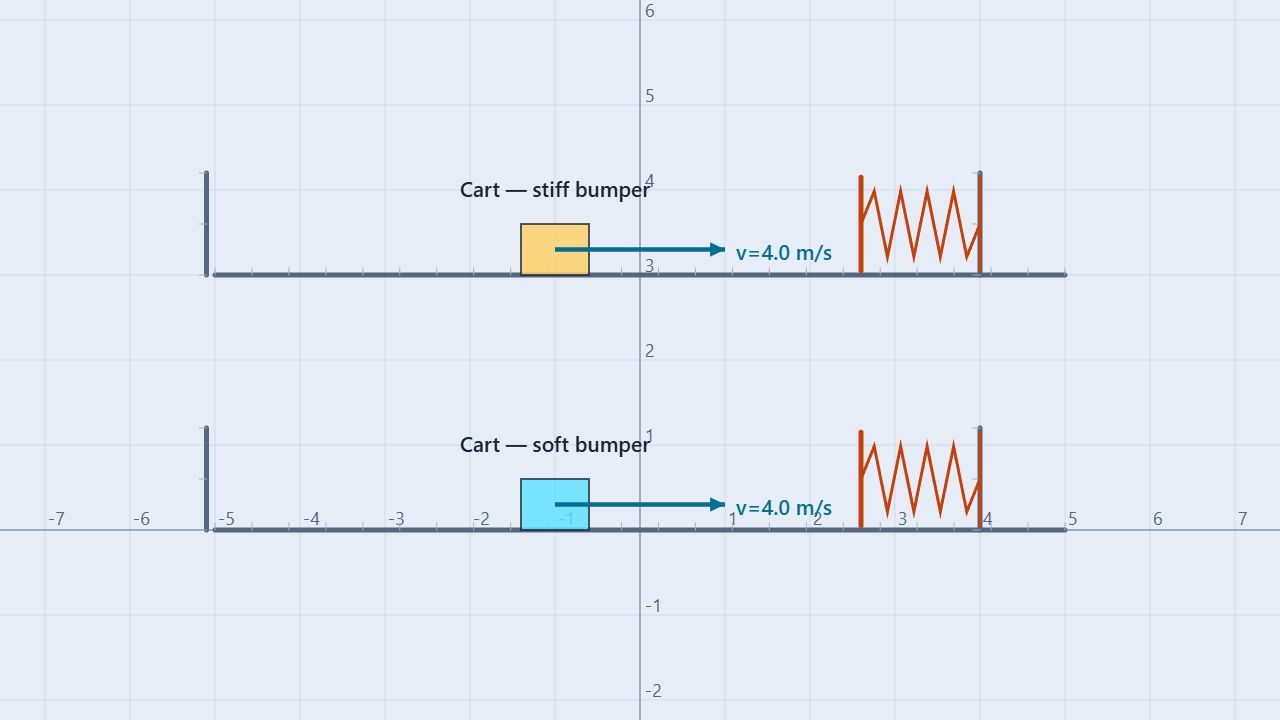
The prepared scene has two equal 1.00 kg carts moving right at 4.00 m/s. The lower cart meets a soft 80 N/m spring bumper; the upper cart meets a stiff 320 N/m bumper. Gravity and friction are disabled for the horizontal comparison.
Keep fixed
Cart mass at 1.00 kg, incoming speed at +4.00 m/s, bumper approach, lane surfaces, and zero friction.
Compare
Spring constant, maximum compression, peak spring force, contact time, force–time area, and momentum change.
The springs are ideal for the baseline, so each cart should leave moving left at about −4.00 m/s. That gives both carts the same momentum change, Δpx = −8.00 kg·m/s, even though the stiff bumper reaches a larger force over a shorter interval.
Build the model
Impulse is the area under the force–time curve
For one cart, the net impulse equals the change in momentum:
Jx = ∫Fx dt = Δpx = m(vxf − vxi)
The spring force opposes the cart’s incoming motion, so its force–time area is negative when +x points right. The magnitude of the area is the size of the momentum change. Do not confuse the area with the peak force: a tall, narrow curve and a short, wide curve can have the same area.
For an ideal spring, incoming kinetic energy becomes spring energy at maximum compression:
½mvi² = ½kxmax²
xmax = vi√(m/k)
Fpeak = kxmax = vi√(mk)
A larger k therefore produces greater peak force and a shorter characteristic contact time, while the ideal spring still returns the same cart momentum with the same incoming speed.
Procedure
Measure area, momentum, and peak force
- Load and inspect. Open Impulse with Spring Bumpers. Select each cart and record its mass and initial velocity. Confirm that the soft bumper reads k = 80 N/m, the stiff bumper reads k = 320 N/m, and friction is disabled.
- Predict the spring response. Calculate maximum compression and peak force from the equations above. Predict that both carts will reverse direction and receive approximately −8.00 N·s of impulse.
- Run the trial. Press Run and let both carts contact their bumpers. Use the Data panel’s Graph view with spring force in the vertical series and time on the horizontal axis.
- Measure the area. Select the Area tool and drag across each spring-force pulse from first contact until the cart leaves the bumper. Record the area under the curve and note its sign. The result should agree with the cart’s Δpx.
- Read the profile. Record the largest force and the time interval between first contact and release. Compare the soft and stiff pulses rather than comparing only one graph height.
- Export and repeat. Export CSV, then change one variable such as incoming speed or cart mass. Keep the other cart as a reference trial.
| Bumper | k (N/m) | Maximum compression (m) | Peak force (N) | Contact time (s) | Impulse (N·s) |
|---|---|---|---|---|---|
| Soft | 80 | 0.447 | 35.8 | 0.351 | −8.00 |
| Stiff | 320 | 0.224 | 71.6 | 0.176 | −8.00 |
The contact-time estimate uses an ideal half-cycle, π√(m/k), for a cart that enters the spring with zero compression. The simulation’s finite contact geometry and sample timing can shift the measured endpoints, so use the graph to define the actual interval.
Worked example
Why the stiff bumper peaks higher
For the stiff bumper, k = 320 N/m, m = 1.00 kg, and vi = 4.00 m/s:
xmax = 4.00√(1.00/320) ≈ 0.224 m
Fpeak = 320(0.224) ≈ 71.6 N
Jx = 1.00(−4.00 − 4.00) = −8.00 N·s
The soft bumper stores the same initial 8.0 J of kinetic energy but compresses twice as far. Its peak force is half as large and its ideal contact interval is twice as long. Both ideal force–time areas still have the same magnitude, 8.0 N·s.
Compare trials
Change speed to change impulse
With the spring constant fixed, doubling the incoming speed doubles the ideal momentum change and impulse. It also doubles maximum compression and peak force because both are proportional to speed.
| Incoming speed (m/s) | Soft peak force (N) | Stiff peak force (N) | Impulse (N·s) |
|---|---|---|---|
| 2.00 | 17.9 | 35.8 | −4.00 |
| 4.00 | 35.8 | 71.6 | −8.00 |
| 6.00 | 53.7 | 107.3 | −12.00 |
As a second extension, keep speed fixed and change cart mass. The impulse changes in proportion to mass when the cart reverses, while the spring’s peak force follows √m and the contact time follows √m for the ideal model.
Interpret the evidence
Read the whole force–time pulse
The graph’s horizontal width represents contact time, its vertical height represents force, and its area represents impulse. A narrow stiff-bumper pulse can be more damaging even when its area matches a wider soft-bumper pulse. Report all three quantities.
Compare the area result with Δpx from the cart’s before-and-after velocities. If they disagree, check whether the selected interval includes the complete force pulse, whether the cart also received a wall or lane contact, and whether the sample was taken before the cart had fully separated.
Common misconceptions
Check the reasoning
Does the largest force determine impulse by itself?
No. Impulse is the area under the force–time curve. Peak force matters only together with how long the force acts and how the curve is shaped.
Does equal impulse mean equal peak force?
No. A soft bumper spreads the same momentum change over a longer time, while a stiff bumper produces a shorter, taller pulse.
Is the area always positive?
The sign follows the chosen axis. A bumper force pointing left has negative area when +x points right. Its magnitude can be compared with the magnitude of the momentum change.
Does an ideal spring permanently remove kinetic energy?
No. It temporarily stores the cart’s kinetic energy and returns it. Any measured loss comes from restitution, friction, damping, or other nonideal interactions.
For teachers
Connect the graph to design choices
Ask students to sketch a wide, low force pulse and a narrow, tall pulse with equal area before opening the Data panel. Then require a table with Fpeak, contact time, area under the curve, and Δp for each bumper.
Discuss why helmets, car crumple zones, and padded gym equipment increase stopping time: for a given momentum change, a longer interval lowers the average force. Review Newton’s Third Law, Work and Kinetic Energy, and One-Dimensional Collision.
Physics reference: OpenStax, Physics, linear momentum and force. Learn about the educator behind the simulations on the BuildPhysics About page.