BuildPhysics

AP Physics 1 · Unit 1 · Kinematics

Position and Velocity Graphs

Connect motion to position–time and velocity–time graphs. Measure slope and area, then test what they tell you about a trip.

Start lesson
  • Free
  • No account required
  • Self-paced
Position and Velocity Graphs guided lesson preview Start guided lesson
Explore the model. Make predictions. Check your thinking.

Learn by doing

Three ideas you’ll put into motion

Read the slope

Compare position graphs and use their slopes to determine velocity.

Measure displacement

Use signed velocity–time area to connect a graph with a change in position.

Match representations

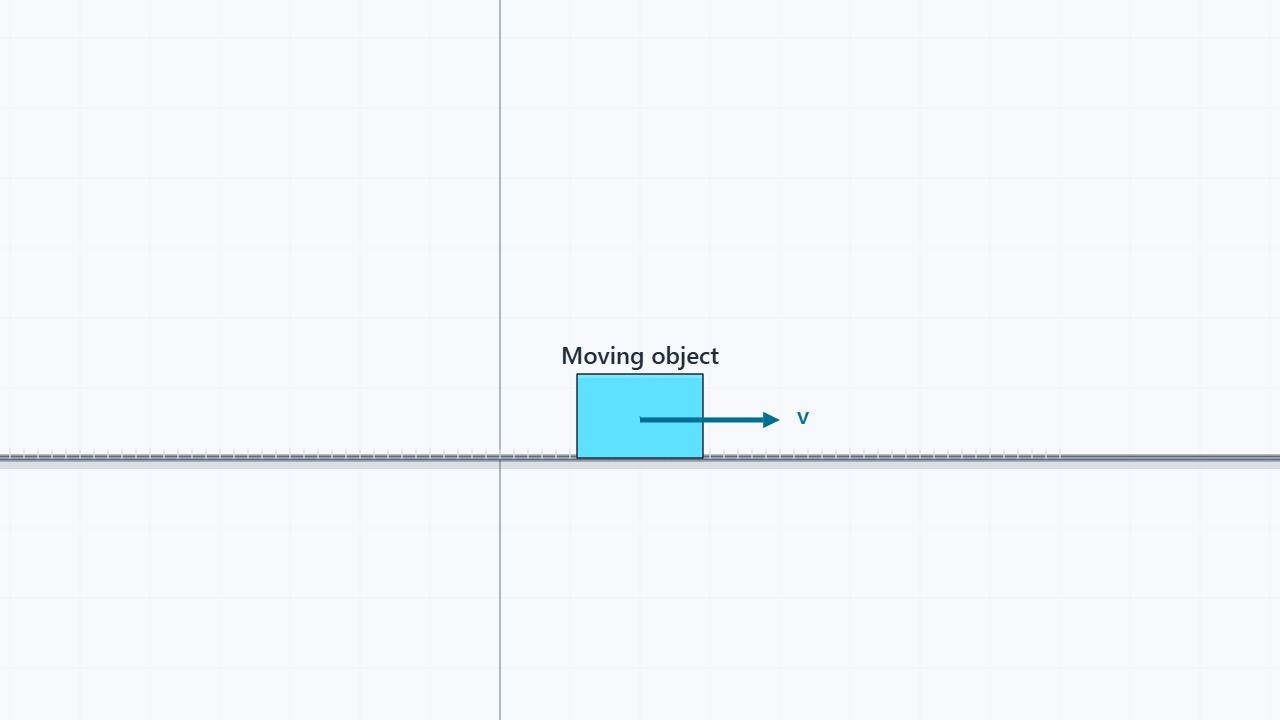
Compare the moving object, its velocity, and its graph before checking your prediction.

The big idea

The key ideas, at a glance.

Position–time slope

The slope of a position–time graph gives velocity. A steeper slope means greater speed; a negative slope means motion in the negative direction.

Velocity–time area

Signed area gives displacement. Portions below the time axis subtract from the net change in position.

A quick comparison

Compare two straight position–time graphs over the same time interval.

Steeper line → greater speed

positiontimeSchematic relationship
Teaching this topic?Classroom fit, AP connections, and support
Classroom fit
Use for a concept introduction, guided independent practice, or a projected class discussion.
Before students begin
Read coordinates and distinguish displacement from distance. Basic division is enough for slope.
Built-in support
Prepared scenes, guided prompts, and feedback on lesson questions.
AP Physics 1 connections
Unit 1: representing motion with graphs, equations, and descriptions.
Check for understanding
Ask students to distinguish the height of a position graph from its slope.
Optional extension
Try the separate Motion Graphing lab for more data collection.
Meet the educator behind Build Physics

Ready to test your thinking?

The first scene is set up. Start the lesson and explore.

Start lesson