
Core idea
Free fall describes the force model
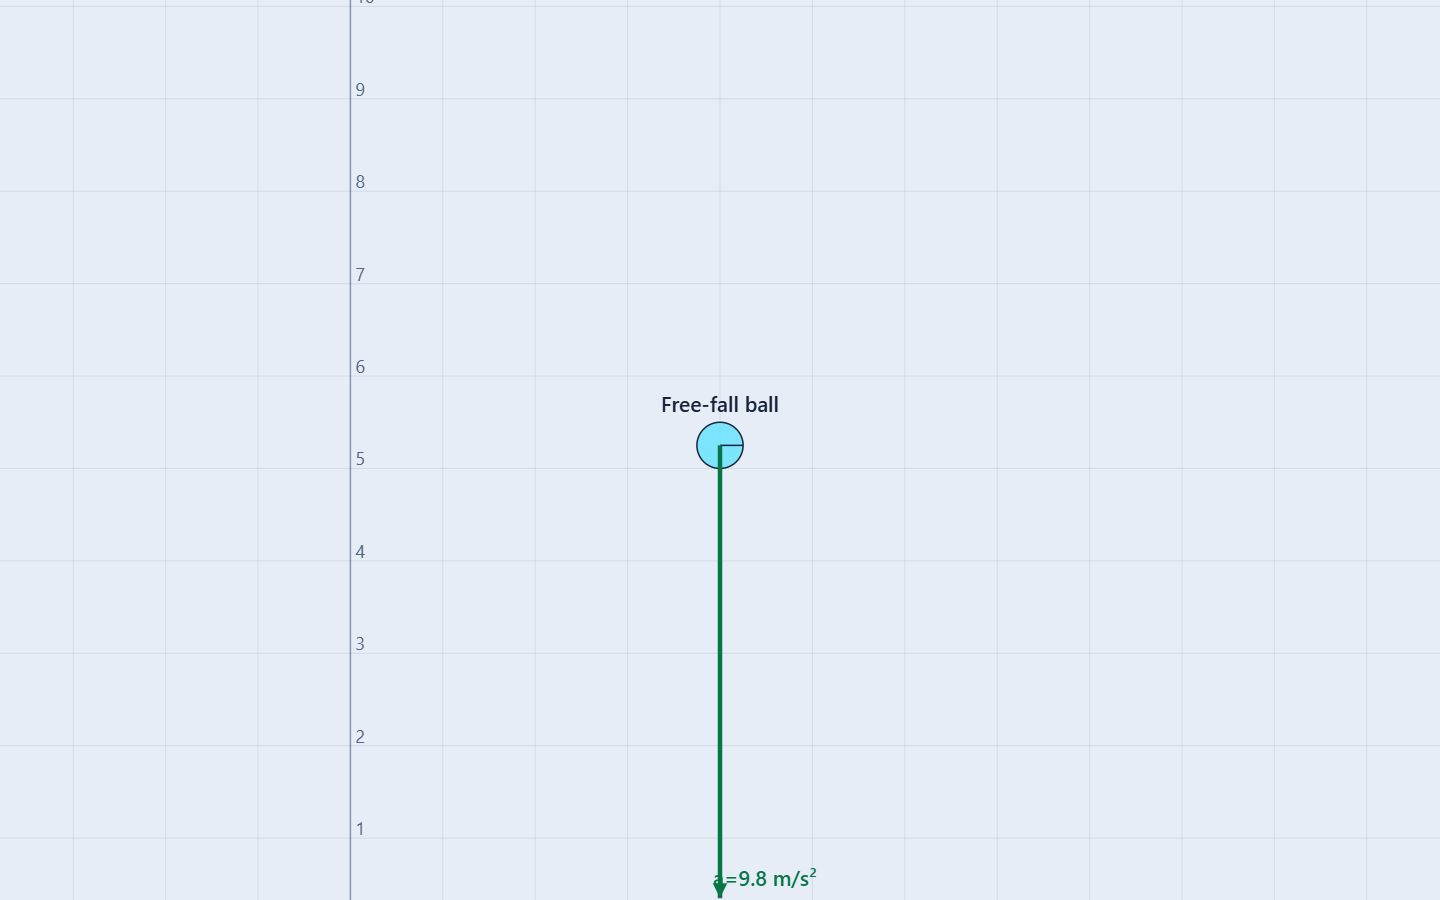
An object is in ideal free fall when gravity is the only force controlling its motion. The object can be moving upward, moving downward, or momentarily stopped. “Free fall” does not mean that the object must already be moving down.
Choose upward as positive for the vertical axis. Near Earth, the gravitational acceleration is then constant and downward:
ay = −g ≈ −9.80 m/s²
Keep the signs connected
A positive vy means upward velocity. A negative vy means downward velocity. A negative ay means the acceleration points downward, even while the object is rising.
Separate velocity from acceleration
Velocity tells you how position is changing now. Acceleration tells you how velocity is changing. They can point in opposite directions when an object is moving up and slowing down.
Build the model
Use the equation that matches the known quantities
For constant vertical acceleration, the three kinematics relationships connect velocity, displacement, and time:
vyf = vyi + ayΔt
Δy = vyiΔt + ½ay(Δt)²
vyf² = vyi² + 2ayΔy
Use the first equation when time and acceleration are useful, the second when you need displacement or time, and the third when time is not given. Keep displacement signed: a downward change in height is negative when up is positive.
For a drop from rest, vyi = 0, so |Δy| = ½g(Δt)². This is why quadrupling the drop distance doubles the fall time, while the impact speed grows with the square root of the drop distance.
Guided investigation
Read one motion three ways
- Start with a gravity-only drop. Open the prepared Free Fall lesson and select the ball. Record its starting y position, mass, and initial vy. Keep air resistance and applied forces off.
- Predict the signs. With up positive, predict that ay will stay negative. During a drop from rest, vy will become increasingly negative while y decreases.
- Use equal time intervals. Compare rows at 0.00, 0.25, 0.50, 0.75, and 1.00 s. Equal changes in velocity during equal time intervals are evidence of constant acceleration.
- Display one graph at a time. On y–t, look for a concave-down curve. On vy–t, measure a straight-line slope. On ay–t, check for a horizontal line near −9.80 m/s².
- Change one condition. Reset before changing release height, mass, shape, or initial vy. Compare predictions and measurements before changing a second condition.
| t (s) | Δy (m) | vy (m/s) | ay (m/s²) |
|---|---|---|---|
| 0.00 | 0.00 | 0.00 | −9.80 |
| 0.25 | −0.31 | −2.45 | −9.80 |
| 0.50 | −1.23 | −4.90 | −9.80 |
| 0.75 | −2.76 | −7.35 | −9.80 |
| 1.00 | −4.90 | −9.80 | −9.80 |
Worked examples
Make the signs do the explaining
One-meter drop from rest. Let Δy = −1.00 m, vyi = 0, and ay = −9.80 m/s²:
−1.00 = ½(−9.80)t²
t = 0.452 s
vyf = (−9.80)(0.452) ≈ −4.43 m/s
Upward launch at +14.7 m/s. At the highest point, set vyf = 0:
0 = 14.7 − 9.8tapex
tapex = 1.50 s
Δyapex = 14.7(1.50) − ½(9.8)(1.50²) = 11.0 m
The velocity is zero at the apex for one instant, but acceleration is still −9.80 m/s². On the way back to the launch height, the velocity is −14.7 m/s: equal speed, opposite direction, in the ideal model.
Graph relationships
Use slope and area as cross-checks
| Graph | What to read | Physics relationship |
|---|---|---|
| y–t | Position from graph height | Slope gives vy; concavity shows the sign of ay |
| vy–t | Velocity from graph height | Slope gives ay; area under the curve gives Δy |
| ay–t | Acceleration from graph height | Area under the curve gives Δv |
For an upward launch, the vy graph crosses zero at the apex. The area above the time axis is positive displacement, and the area below it is negative displacement. Over a complete trip back to the launch height, those signed areas cancel even though the total distance traveled is not zero.
Test the assumptions
Mass, shape, and release height answer different questions
Two objects with different masses fall together in the ideal model because Fg = mg and a = Fg/m = g. Changing mass changes weight and energy values, but not gravitational acceleration. A disk and a block also fall together when air resistance is excluded.
Changing release height changes fall time and impact speed, but not g. For a drop from rest, increasing the height by a factor of four multiplies the time by two and the impact speed by two. An upward initial velocity changes the motion’s starting condition; it does not change the downward acceleration.
Common misconceptions
Check the reasoning
Is acceleration zero at the top?
No. Only vy is zero at the highest point. Gravity continues to produce ay = −9.80 m/s².
Does negative acceleration always mean slowing down?
No. A downward acceleration slows an object that is moving up, but it speeds up an object that is already moving down.
Does a heavier object fall faster?
Not in the ideal no-air-resistance model. Heavier objects have larger gravitational forces and proportionally larger inertia, so the acceleration is the same.
Is every falling object in free fall?
No. A parachute, a supported passenger, or a falling object with significant drag has forces besides gravity acting on it.
For teachers
Make the sign convention visible
Have students write “up is positive” beside every free-fall calculation. Ask them to predict the signs of y change, vy, and ay before running, then use the graph slopes to defend each sign.
Use the one-meter and four-meter drops to test the time-squared relationship. Then compare two masses and two shapes at the same height to separate the ideal gravity model from air-resistance effects. Finish with the +14.7 m/s upward launch so students must explain why zero velocity does not remove acceleration.
Continue with Constant Acceleration for the general graph model, Acceleration Graphs for slope and area under the curve, and Free Fall Motion Simulation for the full virtual lab. The Projectile Motion lesson applies the same vertical equations while horizontal motion proceeds independently.