
Core idea
Graph height, slope, and area answer different questions
A position–time graph reports where an object is at each instant. Its slope is velocity, so the slope sign gives direction and the slope magnitude gives speed. A straight line means constant velocity, a horizontal segment means rest, and a changing slope means the velocity is changing.
A velocity–time graph reports signed velocity directly. Its height tells the direction and magnitude at a given time, while the area under the curve gives displacement. Portions below the time axis count negative, so different parts of a trip can cancel.
Read the x–t slope
Compare slopes, not vertical height. A line can be below x = 0 and still slope upward, which means the object is at a negative position but moving toward increasing x.
Read the v–t area
Add positive and negative rectangular or triangular areas with their signs. The result should agree with xf − xi.
Guided lesson path
Build one graph from simple motion segments
- Start with constant motion. Run a traveler from x = 1.0 m at +2.0 m/s. Equal time intervals produce equal position changes, so the x–t graph is a straight rising line.
- Measure the slope. Display only x and use Slope. The line’s +2.0 m/s slope is the traveler’s velocity.
- Change one feature at a time. Move the starting position to x = 6.0 m without changing velocity, then use −2.0 m/s and 0 m/s. The intercept, slope sign, and horizontal rest segment each carry different information.
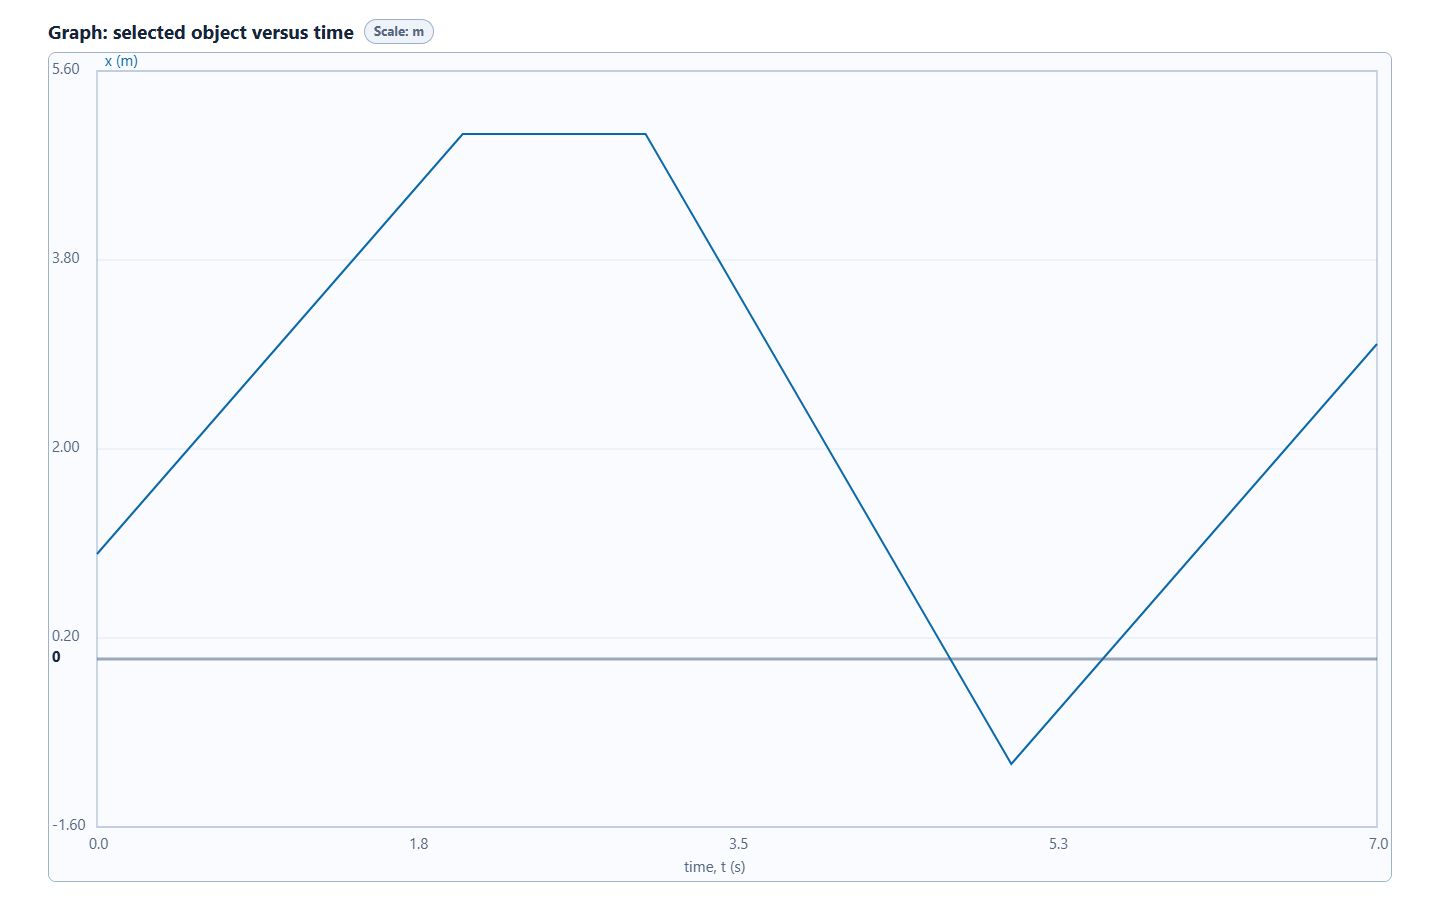
- Assemble a piecewise journey. Use +2.0 m/s for 2 s, 0 m/s for 1 s, −3.0 m/s for 2 s, and +2.0 m/s for 2 s. Each segment’s slope matches its velocity.
- Switch to velocity and area. Display vx, select Area, and compare the total area under the curve with the endpoint displacement.
| Segment | Time interval | Velocity | Ending position |
|---|---|---|---|
| Move right | 0–2 s | +2.0 m/s | 5.0 m |
| Remain at rest | 2–3 s | 0 m/s | 5.0 m |
| Move left | 3–5 s | −3.0 m/s | −1.0 m |
| Move right again | 5–7 s | +2.0 m/s | 3.0 m |
The position graph rises, becomes horizontal, falls more steeply, and rises again. The final position is 3.0 m, so the total signed displacement is +2.0 m.
Worked examples
Use slope for velocity and endpoints for displacement
For the baseline x–t line from (0 s, 1 m) to (2 s, 5 m):
v = slope = Δx/Δt = (5 − 1)/(2 − 0) = +2.0 m/s
For the leftward segment from t = 3 s, x = 5 m to t = 5 s, x = −1 m:
v = (−1 − 5)/(5 − 3) = −3.0 m/s
The same journey’s endpoint calculation gives:
Δx = xf − xi = 3.0 − 1.0 = +2.0 m
Graph relationships
Translate between the three motion graphs
| Graph | Read directly | Useful relationship |
|---|---|---|
| x–t | Position from graph height | Slope = velocity |
| vx–t | Velocity from graph height | Area under the curve = displacement |
| ax–t | Acceleration from graph height | Area under the curve = change in velocity |
For the piecewise journey, the vx–t area under the curve is (2)(2) + (0)(1) + (−3)(2) + (2)(2) = +2 m. This matches the position change from 1 m to 3 m. The negative rectangle records leftward displacement; it does not erase the fact that the traveler moved.
Whole-trip analysis
Use area under the curve to find average velocity
Average velocity uses the complete signed displacement divided by the complete elapsed time:
vavg = Δx/Δt = 2.0 m / 7.0 s = +0.29 m/s
The average is smaller than the segment velocities because the traveler spent time at rest and moved left during part of the journey. If you wanted average speed instead, you would add the absolute distances from all four segments before dividing by 7.0 s.
Changing the initial position shifts the x–t graph vertically but does not change its slope. Changing velocity changes the slope. This separation lets you identify what changed in a graph without guessing from its height.
Common misconceptions
Check the reasoning
Does a higher position graph mean a faster object?
No. The height of an x–t graph is position. Speed is related to the magnitude of its slope.
Does a negative position mean negative velocity?
No. An object can be at x = −1 m and move right with positive velocity. Position tells where it is; slope tells how position is changing.
Does a negative slope mean the object is slowing down?
No. A negative slope means negative velocity. The object could move left at constant speed or speed up or slow down depending on how the slope changes.
Does zero velocity mean the graph must lie on x = 0?
No. Zero velocity produces a horizontal x–t segment at whatever position the object occupies.
For teachers
Ask students to name the graph evidence
Have students predict the shape and slope sign before each trial. Require them to report position, velocity, and acceleration with separate words so “higher,” “steeper,” and “moving right” do not get conflated.
Use the piecewise journey as a compact assessment: students should identify the rest interval, find the −3.0 m/s slope, calculate the +2.0 m area under the curve, and explain why the final position agrees with the area result.
Continue with the Constant Speed Motion Simulation and Virtual Lab, then connect endpoint and path reasoning to Displacement and Velocity and changing slopes to Constant Acceleration. The prepared experiment page provides the interactive setup.