
Plan the investigation
Start with a clear equilibrium point
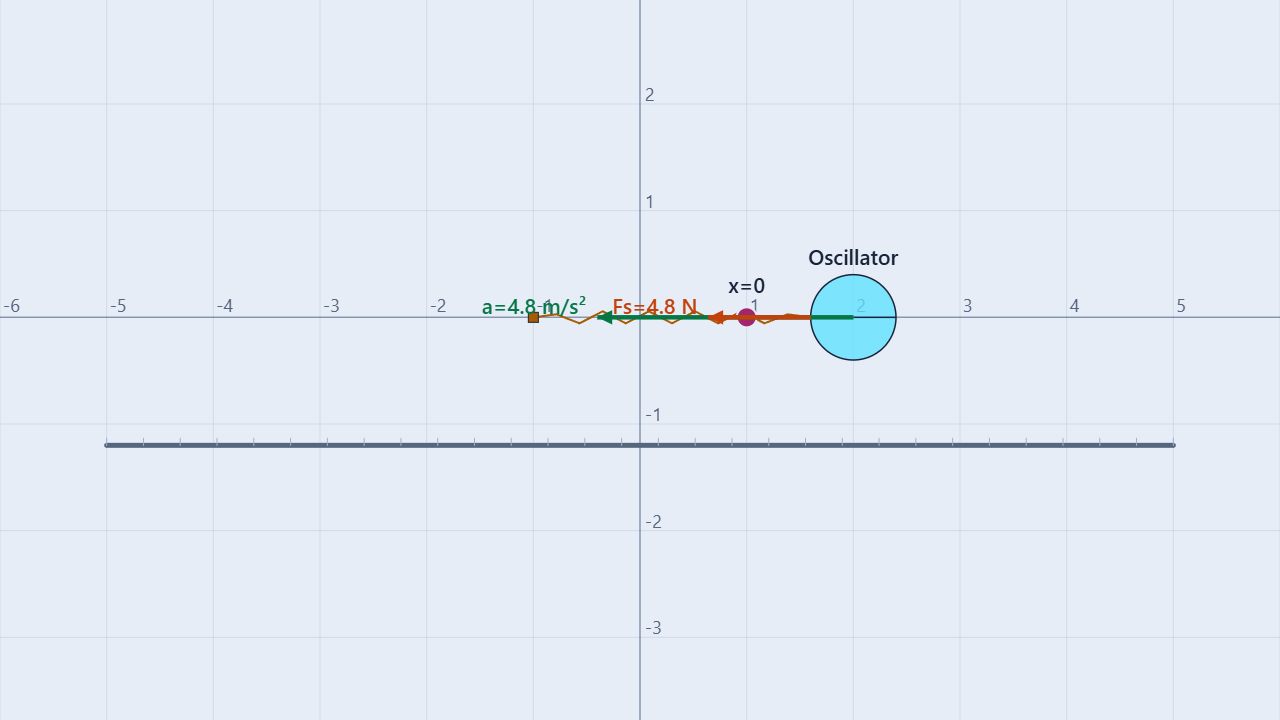
The prepared scene has a 1.00 kg oscillator at x = 2.00 m. A spring is attached to the fixed point at x = −1.00 m, with k = 8.00 N/m and natural length L0 = 2.00 m. Gravity is off, so the spring’s natural-length position xeq = 1.00 m is the equilibrium position. The block starts from rest 1.00 m to the right of equilibrium.
Change one variable
For the first comparison, change attached mass while keeping k, the initial displacement, and the spring geometry fixed. Then reset and compare different spring constants.
Keep fixed
Spring anchor, natural length, starting displacement, initial velocity, gravity, damping, and the object selected for measurement.
Use q = x − xeq for displacement from equilibrium. This avoids confusing the object’s screen coordinate x with the extension that determines the restoring force.
Build the model
Three equations describe the same motion
For an ideal spring, the restoring force points toward equilibrium and is proportional to displacement:
Fs = −kq
a = Fs/m = −(k/m)q
The negative sign means the force and acceleration oppose the displacement from equilibrium. The angular frequency and period are:
ω = √(k/m)
T = 2π/ω = 2π√(m/k)
With negligible damping, energy moves between elastic potential and kinetic forms while their sum stays constant:
E = K + Us = ½mv² + ½kq² = ½kA²
At a turning point, v = 0, spring energy is greatest, and acceleration has its greatest magnitude. At equilibrium, q = 0, spring force and acceleration are zero, and speed is greatest.
Procedure
Measure phase, energy, and period
- Load the baseline. Launch Mass-Spring Oscillator and confirm the oscillator mass is 1.00 kg, k = 8.00 N/m, natural length is 2.00 m, and the block starts from rest.
- Locate equilibrium. The fixed anchor is at x = −1.00 m, so the equilibrium coordinate is xeq = 1.00 m. Record q, not only the absolute coordinate.
- Run several cycles. Turn on position, velocity, acceleration, and energy series for the same oscillator. Let the simulation run long enough to see at least five repeats.
- Measure a period. Choose two matching events, such as successive right-hand turning points, and divide the elapsed time by the number of complete cycles between them. Repeat with a second pair of events.
- Test the model. Reset, change only mass, and repeat. Then restore the baseline and change only k. Compare the measured period with 2π√(m/k).
| Quantity | Calculation | Prediction |
|---|---|---|
| Initial displacement | q = 2.00 − 1.00 | +1.00 m |
| Initial spring force | −(8.00)(1.00) | −8.00 N |
| Initial acceleration | −8.00/1.00 | −8.00 m/s² |
| Angular frequency | √(8.00/1.00) | 2.828 rad/s |
| Period | 2π√(1.00/8.00) | 2.221 s |
| Total mechanical energy | ½(8.00)(1.00²) | 4.00 J |
Numerical integration and the way a graph samples turning points can produce small differences. Use the same event rule and time resolution in every trial.
Worked example
Predict what happens at three positions
For the baseline, A = 1.00 m and ω = 2.828 rad/s. At the initial right-hand turning point, the block is one metre from equilibrium:
q = +1.00 m; v = 0; a = −ω²q = −8.00 m/s²
Us = 4.00 J; K = 0
At equilibrium, q = 0, so the restoring force and acceleration are zero. All 4.00 J is kinetic:
vmax = ωA = (2.828)(1.00) = 2.83 m/s
Halfway from equilibrium to a turning point, q = 0.50 m. The spring energy is 1.00 J, so the remaining 3.00 J is kinetic. The speed is therefore about 2.45 m/s, while acceleration is −4.00 m/s². These three checkpoints make the phase relationships visible before using a graph.
Compare trials
Use mass and stiffness as controlled variables
For fixed amplitude, changing mass changes the period but does not change the ideal total energy ½kA². Changing k changes both period and energy when amplitude is held fixed.
| Mass (kg) | k (N/m) | Predicted T (s) | What to test |
|---|---|---|---|
| 0.50 | 8.00 | 1.571 | Half the mass should shorten T by √2 |
| 1.00 | 8.00 | 2.221 | Baseline |
| 2.00 | 8.00 | 3.142 | Double the mass should lengthen T by √2 |
| 1.00 | 4.00 | 3.142 | Half the stiffness should lengthen T by √2 |
| 1.00 | 16.00 | 1.571 | Double the stiffness should shorten T by √2 |
Do not change mass and stiffness together if the goal is to identify causation. A useful follow-up is to change amplitude while keeping mass and k fixed; the ideal period should stay nearly unchanged even though total energy changes with A².
Interpret the evidence
Read the phase relationships
Position, velocity, and acceleration repeat with the same period but reach their extrema at different times. The slope of the position graph is velocity, and the slope of the velocity graph is acceleration. Acceleration always has the opposite sign from displacement.
q = A cos(ωt + φ)
v = −ωA sin(ωt + φ)
a = −ω²A cos(ωt + φ)
Compare the energy graphs as a second check. Spring energy peaks when speed is zero; kinetic energy peaks when the block passes equilibrium. A small drift in K + Us indicates numerical or damping effects, while an apparent mismatch caused by comparing different times is a measurement error.
Common misconceptions
Check the reasoning
Is zero velocity the same as zero acceleration?
No. At a turning point the velocity is zero, but the spring is stretched or compressed the most, so acceleration magnitude is greatest.
Does a heavier mass experience a weaker spring force?
Not at the same displacement. The spring force is set by kq; the heavier mass has smaller acceleration because the same force is divided by a larger mass.
Does a larger amplitude change the ideal period?
No, for an ideal linear spring. It increases total energy and the maximum speed, but T = 2π√(m/k) contains neither amplitude nor energy.
Should spring force use the absolute screen coordinate?
No. Use displacement from equilibrium, q = x − xeq. The force is zero at the natural-length equilibrium in this gravity-free setup.
For teachers
Make the model visible before the algebra
Ask students to mark the anchor, natural-length point, equilibrium point, and initial position on a number line. Have them predict the signs of q, Fs, and a before pressing Play. That sign check prevents the common mistake of treating “right” as a permanently positive force.
Require a multi-cycle period measurement and a table that includes predicted and measured values. A plot of T² against mass should be linear with slope 4π²/k; a plot of T² against 1/k should be linear with slope 4π²m. Discuss why damping, timing resolution, and a non-linear spring would limit the ideal model.
Use the Hooke’s Law guide to introduce the force model, then connect the energy exchange to Conservation of Mechanical Energy. Compare the oscillator’s phase relationships with the Period of a Pendulum experiment. Physics reference: OpenStax, College Physics 2e, §16.2.