
Plan the investigation
How does release height set the landing point?
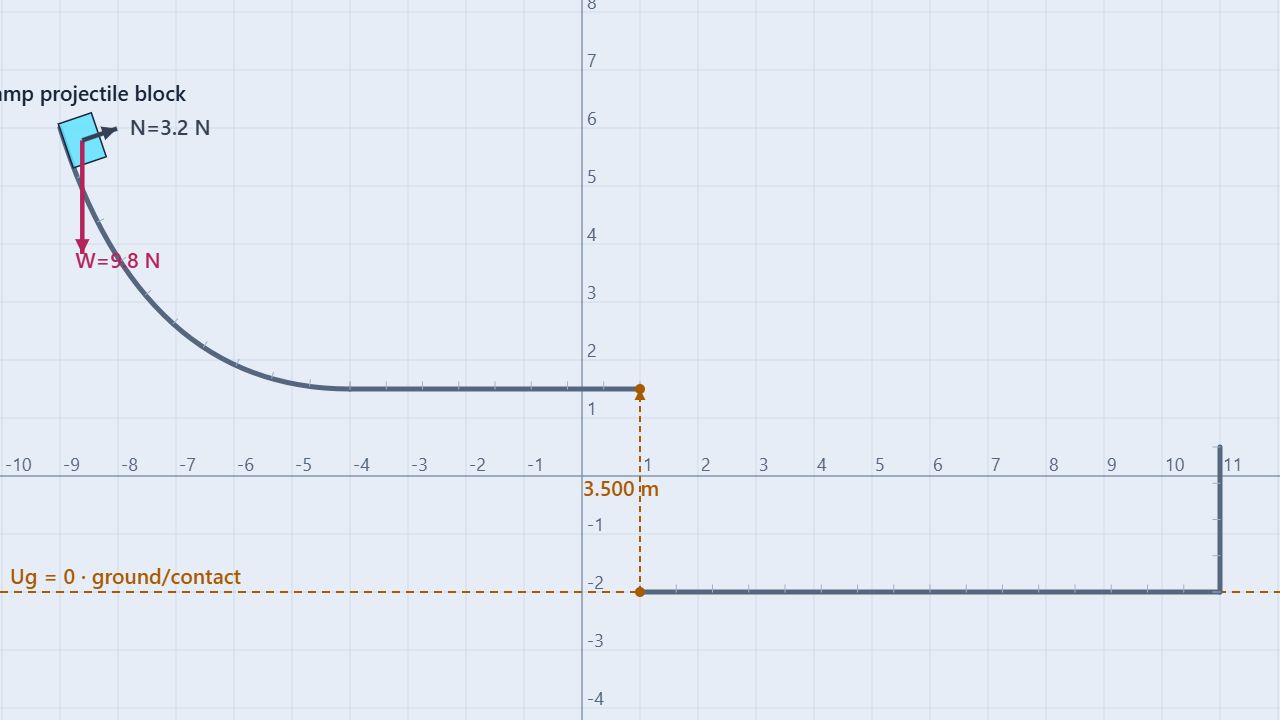
The prepared scene releases a 1 kg ramp projectile block from rest on a frictionless curved ramp. The block descends to a horizontal table whose top is at y = 1.50 m, leaves the table at x = 1.00 m, and lands on ground at y = −2.00 m. The block’s center is 0.30 m above each surface, so its center falls 3.50 m during flight.
m g Δhramp = ½mvedge²
tflight = √(2Δyflight/g)
R = vx,edgetflight
Change one variable
Move the block to a different release height on the same ramp. Keep mass, table height, ground height, gravity, and the friction settings fixed for a fair comparison.
Measure the chain
Record release center height, table-edge speed, flight time, horizontal range, and landing position. The first stage predicts the initial condition for the second stage.
Friction is disabled globally and the ramp, table, and landing ground all have zero friction coefficients. The normal force changes the direction of motion on the ramp and supports the block on the table, but it does no work in this ideal stationary-track model.
Build the model
Split the motion into energy and kinematics
From release to the table edge, the block’s gravitational potential energy becomes kinetic energy. Mass cancels when the block starts from rest:
m g (yrelease − yedge) = ½mvedge²
vedge = √(2gΔhramp)
After the block leaves the table, use projectile motion. The launch is horizontal in the prepared scene, so vy,0 ≈ 0 and the flight time depends only on the center-height drop from the table to the ground.
Δyflight = ytable,center − yground,center
y = y0 − ½gt²
R = vx,edgetflight
The ramp’s shape can change how long the block takes to reach the table, but it does not change the ideal edge speed for the same vertical drop. Range changes when release height changes because the edge speed changes; it also changes if the table or landing height changes.
Procedure
Measure release height, edge speed, and range
- Load and inspect. Open the Ramp, Table, and Projectile Motion simulation. Select the block and record its mass and center y position. Confirm the table top is y = 1.50 m and the landing ground is y = −2.00 m.
- Calculate the ramp drop. Use the difference between the release center height and the table-edge center height, not the distance along the curved ramp.
- Predict edge speed. Calculate vedge = √(2gΔhramp) for the block released from rest. Record the predicted value before running.
- Run the baseline. Turn on Data or keep the trail visible. Run until the block leaves the table and lands. Record the measured table-edge speed and the time from table edge to ground contact.
- Predict the landing. Use the 3.50 m center-height drop to calculate tflight, then multiply by the measured or predicted horizontal edge speed to find range. Compare xlanding with the observed position.
- Change release height. Reset, move the block to two or three other points on the ramp, and repeat. Keep the table and ground fixed. Compare vedge² with release-height drop.
- Test a different ramp shape. If you build a second frictionless path with the same start and end heights, compare table-edge speeds. The ideal speeds should agree even if travel times differ.
- Export evidence. Keep calculated predictions and measured values in separate columns. Report whether disagreement appears during the ramp stage, the flight stage, or the landing contact.
| Quantity | Calculation | Prediction |
|---|---|---|
| Release center height | Prepared ramp position | 5.787 m |
| Table-edge center height | 1.50 + 0.30 | 1.800 m |
| Ramp height drop | 5.787 − 1.800 | 3.987 m |
| Ideal edge speed | √(2 × 9.80 × 3.987) | 8.840 m/s |
| Flight center-height drop | 1.800 − (−2.00 + 0.30) | 3.500 m |
| Ideal flight time | √(2 × 3.500 / 9.80) | 0.845 s |
| Ideal horizontal range | 8.840 × 0.845 | 7.471 m |
With the prepared table edge at x = 1.00 m, the ideal landing center is approximately x = 8.471 m. Treat that as a baseline prediction; the measured edge speed and landing position are the evidence to report.
Compare trials
Release height controls speed and range
For a 1 kg block released from rest with g = 9.80 m/s² and the same 3.50 m flight drop, the following values are calculated predictions. The release height is measured relative to the table-edge center at y = 1.800 m.
| Ramp drop (m) | Edge speed (m/s) | Flight time (s) | Range (m) |
|---|---|---|---|
| 1.000 | 4.429 | 0.845 | 3.742 |
| 2.000 | 6.261 | 0.845 | 5.289 |
| 3.000 | 7.672 | 0.845 | 6.482 |
| 3.987 | 8.840 | 0.845 | 7.471 |
Plot edge speed squared against ramp height drop. A straight line with slope 2g supports the energy model. Plotting range against height drop produces a square-root curve because range is proportional to √Δh when flight height is fixed.
Worked example
Predict a landing from a 2.00 m release drop
Suppose the block is released from a point 2.00 m above the table-edge center. The table and ground remain at their prepared heights:
vedge = √(2 × 9.80 × 2.00) = 6.261 m/s
tflight = √(2 × 3.500 / 9.80) = 0.845 s
R = 6.261 × 0.845 = 5.289 m
xlanding = 1.000 + 5.289 = 6.289 m
The same flight time is used because the table and ground did not move. Only the edge speed and therefore the horizontal range changed.
Interpret the evidence
Use the graphs to locate the model stage
During the ramp stage, gravitational potential energy decreases while kinetic energy increases. At the table edge, the block’s horizontal speed becomes the initial velocity for the flight. During flight, the horizontal velocity stays approximately constant while vertical velocity becomes more negative.
Compare the measured total mechanical energy before the edge with the value after the edge. The table normal force should not change the total in the ideal model. Small changes can come from numerical integration or contact corrections; a large change suggests friction, a nonzero launch angle, or an incorrect height reference.
Use the position and velocity data to check each stage separately. A correct ramp prediction with an incorrect landing position usually points to the flight-height or range measurement, not to the energy equation.
Common misconceptions
Check the reasoning
Does the ramp’s path length determine the edge speed?
No. For a frictionless stationary ramp, the speed depends on vertical height drop. A longer path can change travel time without changing the final speed.
Does the block keep accelerating horizontally after it leaves the table?
No. In the ideal projectile stage, horizontal acceleration is zero, so horizontal speed stays constant.
Should the block’s mass change the ideal edge speed?
No. Mass cancels from m g Δh = ½mv². Mass changes the energy values but not the speed for the same height drop.
Is flight time based on the ramp height?
No. Flight time uses the vertical drop from the table-edge center to the landing center after the block leaves the table.
Does the area under the path curve determine range?
No. Horizontal range is the horizontal displacement during flight: R = vxt. The curved ramp only sets the launch conditions.
For teachers
Make students carry the launch condition into projectile motion
Have students calculate the baseline before pressing Run. First record the block’s center y-coordinate at release. When the block reaches the table edge, record the center y-coordinate again; do not substitute the table’s top surface height for the center height. Subtract those two readings to get the ramp drop, Δhramp = yrelease,center − yedge,center, then use vedge = √(2gΔhramp) to predict the speed at the edge. Next use the center’s vertical drop from the table edge to the ground to predict flight time and horizontal range. A useful table therefore includes release center height, edge center height, predicted edge speed, measured edge speed, predicted flight time, and measured range.
For a stronger investigation, use two different ramp shapes with the same start and end heights. Compare edge speed and travel time separately. Then change table height while holding edge speed fixed to show that range can change through flight time alone.
Continue with Spring-Launched Projectile to replace gravitational release energy with elastic energy, or Rolling Launch Into Projectile Motion to include rotational kinetic energy. Review Projectile Motion and Conservation of Energy.
Physics references: OpenStax, College Physics 2e, §8.3 and OpenStax, College Physics 2e, §5.3. Learn about the educator behind these simulations on the BuildPhysics About page.