
Plan the investigation
Separate the ramp stage from the flight stage
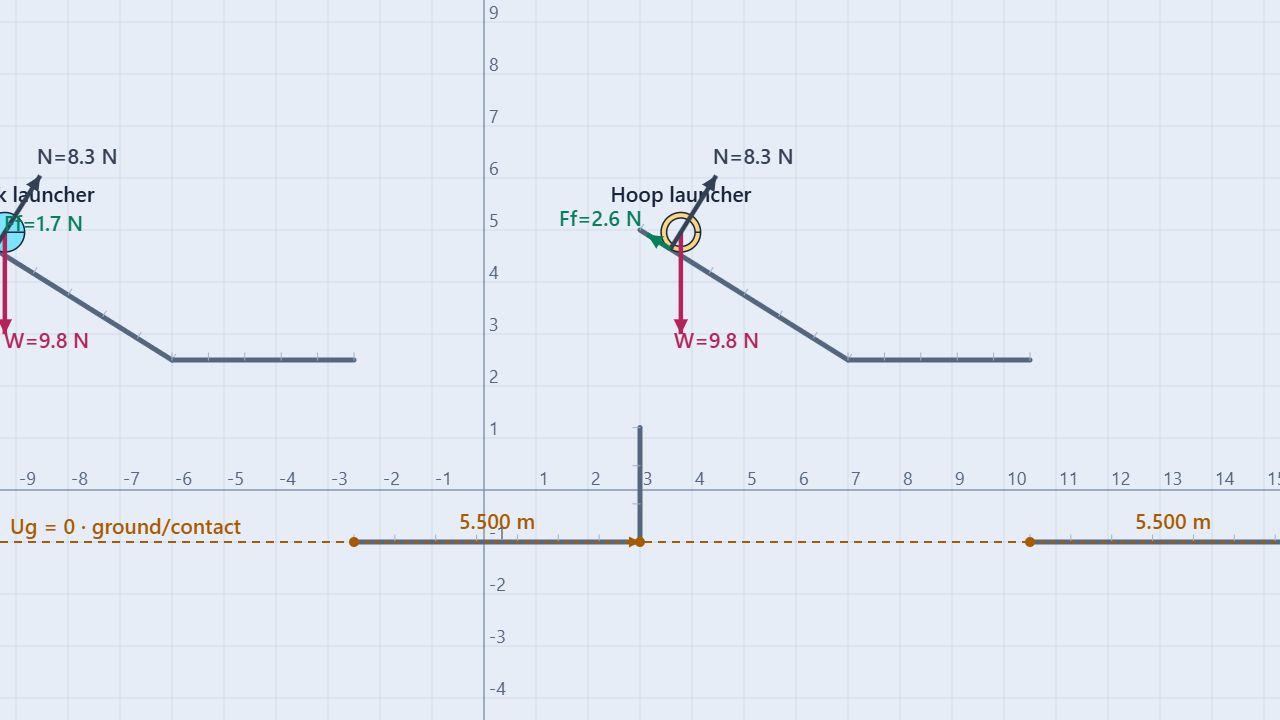
The prepared scene has two parallel lanes. Each lane has a ramp that drops 2.50 m to a horizontal table at y = 2.50 m. The landing ground is at y = −1.00 m, so each object launches horizontally from a height of 3.50 m above its landing surface. The left lane uses a 1.00 kg solid disk; the right lane uses a 1.00 kg thin hoop. Both have radius 0.38 m.
Keep fixed
Mass, radius, ramp height, table height, release speed, ramp conditions, and horizontal-launch direction.
Change one variable
Change object shape or inertia factor to test launch speed, or change table height to test flight time and range.
Analyze the experiment in two steps. First predict the rolling speed at the table edge. Then use that horizontal speed and the table-to-ground height to predict flight time and landing range.
Build the model
Use energy first, then projectile kinematics
For rolling without slipping, v = Rω and I = kMR². If an object starts from rest and drops through height hr on the ramp:
Mghr = ½Mvx² + ½Iω²
vx = √(2ghr/(1 + k))
At the table edge the launch is horizontal, so the vertical initial velocity is zero. If the launch height above the ground is H:
H = ½gt²
t = √(2H/g)
range = vxt
Combining the stages shows why the shape changes range when ramp height is fixed:
range = √(2ghr/(1 + k)) · √(2H/g)
The table height controls flight time equally for both objects. The rotational-inertia factor controls the launch speed, so the disk travels farther even though both objects leave tables at the same height.
Procedure
Predict the landing point before running
- Load and inspect. Open Rolling Launch Into Projectile Motion. Record each object’s mass, radius, shape, and inertia factor, along with ramp height, table height, and landing-ground height.
- Check the release. Confirm both objects start from rest at the same ramp height and roll without slipping. Keep the disk in the left lane and hoop in the right lane for clear range measurements.
- Predict launch speed. Use the rolling-energy equation to calculate vx and ω at each table edge.
- Predict flight. Use the 3.50 m table-to-ground height to calculate the common flight time, then multiply by each launch speed to predict horizontal range.
- Run and record. Run the simulation until both objects land. Record launch speed, angular speed, flight time, landing x-position, and horizontal range from each table edge.
- Change one setting. Reset and change only the rolling shape or table height. Decide whether the new trial should change launch speed, flight time, or both before running it.
| Object | Inertia factor k | Launch speed vx | Launch angular speed ω | Predicted range |
|---|---|---|---|---|
| Solid disk | 0.50 | 5.72 m/s | 15.0 rad/s | 4.83 m |
| Thin hoop | 1.00 | 4.95 m/s | 13.0 rad/s | 4.18 m |
Both objects have the same ideal flight time, t = √(2(3.50)/9.80) ≈ 0.845 s. Measure range from the end of each table, not from the ramp’s starting position.
Worked example
Predict the disk’s landing distance
For the disk, k = 0.50 and the ramp drop is 2.50 m:
vx,disk = √(2(9.80)(2.50)/(1 + 0.50)) = 5.72 m/s
ωdisk = 5.72/0.38 = 15.0 rad/s
The disk launches from 3.50 m above the ground:
t = √(2(3.50)/9.80) = 0.845 s
rangedisk = (5.72)(0.845) = 4.83 m
For the hoop, the same flight time applies, but its larger inertia factor lowers launch speed to about 4.95 m/s and its ideal range to about 4.18 m. The range difference comes from the ramp stage, not from different fall times.
Compare trials
Change shape or table height
Use shape trials to test the rolling-energy stage and table-height trials to test the projectile stage. Keep the other stage controlled so the evidence identifies the source of the change.
| Trial | Launch speed | Flight time | Range | What changes? |
|---|---|---|---|---|
| Solid disk, H = 3.50 m | 5.72 m/s | 0.845 s | 4.83 m | Baseline |
| Thin hoop, H = 3.50 m | 4.95 m/s | 0.845 s | 4.18 m | Inertia changes launch speed |
| Solid disk, H = 2.00 m | 5.72 m/s | 0.639 s | 3.66 m | Lower table shortens flight |
| Solid disk, H = 5.00 m | 5.72 m/s | 1.01 s | 5.76 m | Higher table lengthens flight |
When table height changes, the launch speed should stay fixed if the ramp stage is unchanged. When object shape changes, flight time should stay fixed if both table heights are unchanged.
Interpret the evidence
Use launch and flight measurements together
Record the ramp-stage speed and the projectile-stage landing data separately. A useful check is that the same measured launch speed predicts the observed range when multiplied by the measured flight time.
Rroll = v − Rω
Rflight = range − vxt
Renergy = Mghr − ½Mvx² − ½Iω²
Small residuals support both stages of the model. If the range residual is large while the flight-time prediction is good, inspect the launch-speed or range measurement. If flight time is wrong, check the table-to-ground height and vertical launch velocity.
Common misconceptions
Check the reasoning
Does the hoop fall for longer than the disk?
No. With equal table heights and horizontal launches, their vertical motion is the same. The hoop lands closer because it leaves the table with a smaller horizontal speed.
Does the table height change launch speed?
No. Table height changes flight time and range. Ramp height and inertia factor determine the rolling launch speed in this model.
Can I use the total ramp distance as projectile range?
No. Projectile range starts at the table edge and ends at the landing point. Measure the horizontal distance after launch.
Does a larger angular speed mean a larger range?
Not by itself. Range depends on linear launch speed and flight time. Use v = Rω to connect the angular and linear measurements.
For teachers
Make the two stages explicit
Ask students to draw a boundary at the table edge. Before that boundary they should use rolling energy; after it they should use projectile kinematics. This prevents mixing the ramp height with the table-to-ground height.
Have groups change one stage at a time: compare disk and hoop at fixed table height, then change table height with one object. Require each group to predict which measured quantity changes before running its trial.
Review Conservation of Mechanical Energy, Projectile Motion, and Rolling Objects. Physics reference: OpenStax, Physics, §11.1 Rolling Motion. Learn about the educator behind the simulations on the BuildPhysics About page.