
Plan the investigation
How does a spring launch become a range?
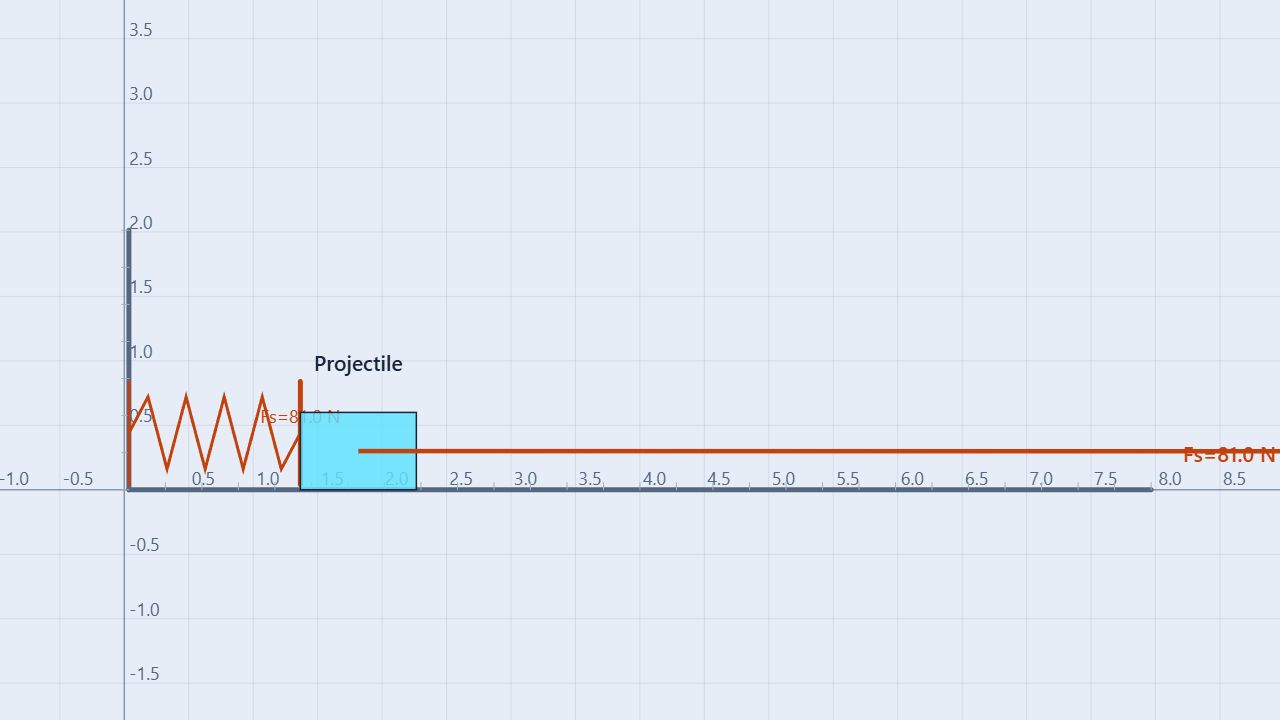
The prepared scene begins with a 5 kg projectile held against a horizontal launcher spring. The spring has k = 50 N/m and starts compressed by about 1.621 m, while the launch table is at y = 0. After the projectile leaves the table, it falls to a lower landing surface whose center-to-center drop is about 8.011 m.
Us = ½kx²
K = ½mv²
Us → K → projectile range
Change one variable
Change the launcher’s relaxed length to change compression, or change projectile mass. Keep the spring constant, table height, landing height, and friction setting fixed for a fair comparison.
Measure the chain
Record compression, elastic energy, speed at the table edge, flight time, and horizontal range. Each measurement explains the next part of the motion.
In this preset, the launch table and projectile have zero friction coefficients and the global friction toggle is off. The normal force supports the projectile on the table; it does not add energy because it is perpendicular to the horizontal motion.
Build the model
Follow energy from the spring to the landing point
For an ideal launcher, the energy stored by compression becomes the projectile’s kinetic energy. If the spring is compressed by x and the projectile starts from rest:
Us,i = ½kx²
½kx² ≈ ½mvedge²
vedge ≈ x√(k/m)
The approximation is most useful when the table is level, friction is negligible, and the launcher’s small downward angle is ignored. The simulation’s measured edge speed can differ slightly because the spring force acts over a finite interval and the contact solver handles the launcher and table.
Once the projectile leaves the table, the spring no longer pushes it. Treat the launch as horizontal: vy,0 ≈ 0, so the fall time depends on the vertical drop while the horizontal range depends on the edge speed.
tflight = √(2Δy/g)
R = vx,edgetflight
xlanding = xedge + R
Procedure
Measure the launch, flight, and landing
- Load and inspect. Open the Spring-Launched Projectile simulation. Select the projectile and record its mass. Select the launcher and record k, relaxed length, and the displayed compression before running.
- Calculate stored energy. Use Us = ½kx². Write down the compression in meters and the energy in joules; do not use the launcher’s relaxed length as the compression.
- Predict the edge speed. Use ½kx² ≈ ½mv² to calculate an ideal launch speed. State the assumptions that make this estimate reasonable: level table, no friction, and negligible launcher angle.
- Run the baseline. Show vector values or open Data, then run until the projectile leaves the table and reaches the lower landing surface. Record the speed at the edge, flight time, and horizontal range from the table edge.
- Check the projectile prediction. Measure the vertical center-to-center drop. Calculate tflight = √(2Δy/g), then calculate R = vx,edgetflight. Compare the predicted landing position with the observed one.
- Change compression. Reset, change only the launcher’s relaxed length, and repeat at three compressions. Plot edge speed against x and range against x. The ideal model predicts speed and range are approximately proportional to x when the flight height stays fixed.
- Change mass. Reset to the original compression and change only the projectile mass. The model predicts vedge ∝ 1/√m, while stored spring energy stays the same. Record whether the measured range follows that trend.
- Export evidence. Keep the raw compression, edge-speed, flight-time, and range columns. Label calculated values separately from measurements so the comparison remains testable.
| Quantity | Calculation | Prediction |
|---|---|---|
| Spring compression | Launcher readout | 1.621 m |
| Stored elastic energy | ½(50)(1.621)² | 65.7 J |
| Ideal table-edge speed | √(2 × 65.7 / 5.00) | 5.13 m/s |
| Vertical center drop | 0.300 − (−7.711) | 8.011 m |
| Ideal flight time | √(2 × 8.011 / 9.80) | 1.279 s |
| Ideal horizontal range | 5.13 × 1.279 | 6.56 m |
The predicted landing center is therefore about 6.56 m beyond the table edge, or approximately x = 14.52 m when the edge is x ≈ 7.96 m. Treat these as a baseline calculation; the measured edge speed and landing position are the evidence to report.
Worked example
Why doubling compression does not double energy
Suppose the launcher has k = 50 N/m and the compression changes from 0.50 m to 1.00 m. The spring force doubles, but the stored energy depends on compression squared:
Us,0.50 = ½(50)(0.50)² = 6.25 J
Us,1.00 = ½(50)(1.00)² = 25.0 J
At fixed mass and launch height, ideal speed and range are proportional to compression, so the 1.00 m trial has twice the speed and twice the range of the 0.50 m trial even though it has four times the stored spring energy. The extra energy is required because kinetic energy depends on v².
Interpret the evidence
Use graph shape to test the model
A graph of edge speed versus compression should be close to a straight line through the origin when mass, k, table height, and friction are fixed. A graph of stored spring energy versus compression should curve upward because Us ∝ x².
For a fixed landing height, range follows the same compression trend as launch speed. If range changes while edge speed does not, check whether the table height, launch direction, or landing measurement changed. If measured speed is below the ideal value, inspect friction, contact losses, and whether the launcher was actually reset to the same compression.
Use the energy graph to separate stages: elastic energy falls during compression release, kinetic energy rises on the table, and gravitational potential energy changes during the fall. After release, the spring force should be zero for the projectile.
Common misconceptions
Check the reasoning
Is spring energy kx?
No. kx is the spring-force magnitude. Stored elastic energy is ½kx².
Does doubling compression double stored energy?
No. Doubling compression makes the ideal stored energy four times larger.
Does the spring keep pushing after the projectile leaves?
No. Spring force belongs to the launcher–projectile contact stage. During free flight, gravity is the relevant force in this preset.
Does a heavier projectile travel farther from the same spring release?
Usually no. The spring stores the same energy, but v = √(2Us/m) decreases as mass increases.
Is range determined by launch speed alone?
No. Range also depends on flight time, which depends on launch height, landing height, and vertical launch velocity.
For teachers
Make the energy and kinematics tests reinforce each other
Have students calculate the baseline before touching Run. Require one table with measured compression, calculated Us, measured edge speed, calculated flight time, and measured range. Ask students to mark which columns come from the simulation and which come from equations.
For a stronger model test, use three compression values and fit speed versus x. Then repeat one compression with two masses and compare v√m. Keep the friction toggle and launch height unchanged while collecting each series.
Continue with Spring Launch Up a Curved Ramp to follow elastic energy into gravitational potential energy, or Ramp, Table, and Projectile Motion to compare gravitational release height with table-edge range. Review Hooke’s Law, Projectile Motion, and Conservation of Energy.
Physics references: OpenStax, College Physics 2e, §16.2 and OpenStax, College Physics 2e, §5.3. Learn about the educator behind these simulations on the BuildPhysics About page.