
Plan the investigation
Reaching the top is only half the question
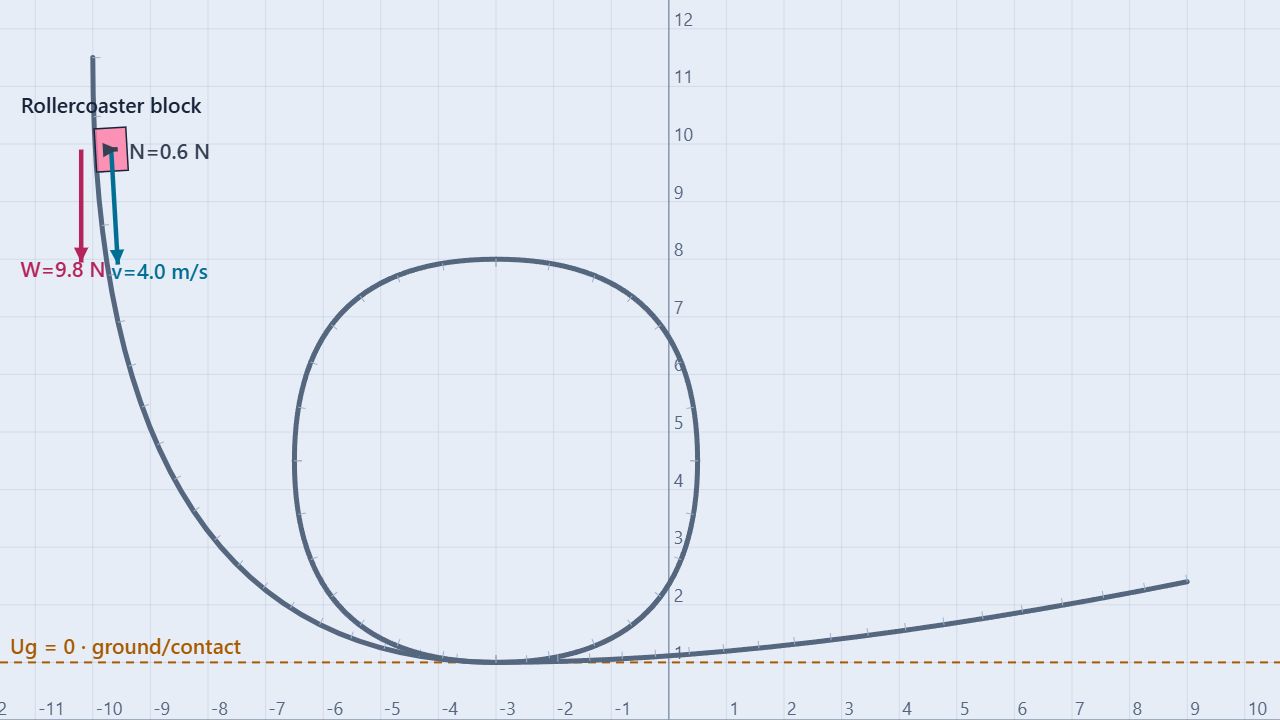
The prepared scene starts a 1.00 kg block at about 4.00 m/s on a frictionless approach. The linked track rises into a loop with a centerline bottom near y = 1.00 m, a top near y = 8.00 m, and a centerline radius of about 3.50 m. The run begins with roughly 92.6 J of mechanical energy in the simulator.
Change one variable
Change the starting height or initial speed while keeping mass, loop radius, gravity, and friction fixed. A fair trial changes one cause at a time.
Measure the evidence
Record speed, normal force, and K + Ug at the bottom, sides, and top. Use the top normal force to decide whether contact is maintained.
Keep the global friction setting off for the baseline. The ideal calculations below describe the track centerline; the block has finite size, so use the selected block’s Properties and Data panels for the measured values.
Build the model
Use energy for speed, then forces for contact
Mechanical energy trades between kinetic and gravitational potential energy as the block climbs:
K + Ug = constant
½mvtop2 + mgytop = ½mvstart2 + mgystart
At the top of a circular loop, inward is downward. Weight and the track’s normal force must provide the required inward net force:
Ntop + mg = mvtop2/r
Ntop = m(vtop2/r − g)
The block stays in contact only while Ntop ≥ 0. At the limiting case, the normal force is zero and gravity alone supplies the inward acceleration:
vtop,min = √(gr) = √(9.80 × 3.50) ≈ 5.86 m/s
This gives two different checks: energy determines whether the block can reach the top with enough speed, while the force equation determines whether the track can keep pushing on it there.
Procedure
Find the contact threshold from data
- Load and inspect. Open the Energy in a Rollercoaster Loop simulation. Select the Rollercoaster block and verify mass, gravity at 9.80 m/s² downward, the ground energy reference, and friction disabled.
- Record the baseline. Before pressing Run, write down the initial speed, center height, loop radius, and total mechanical energy. Check that the system totals show kinetic plus gravitational energy.
- Predict the top. Use energy conservation to calculate the ideal centerline top speed. Compare it with 5.86 m/s, the minimum top speed for a 3.50 m loop.
- Run one complete attempt. Start the simulation and pause near the first top passage. Record the block’s speed, normal force, height, and mechanical-energy total. A positive top normal force supports contact; a value near zero is the threshold.
- Map the loop. Repeat the reading near the bottom and sides. Speed should be greatest near the bottom and smallest near the top, while the total mechanical energy should remain nearly flat in the frictionless run.
- Run controlled trials. Reset between trials and change only initial speed or starting height. Use one trial just below the predicted threshold and one above it. Export the data so predictions and measurements remain traceable.
| Quantity | Calculation | Prediction |
|---|---|---|
| Loop centerline radius | (8.00 − 1.00)/2 | 3.50 m |
| Initial kinetic energy | ½(1.00)(4.00)² | 8.0 J |
| Ideal top speed | √(4.00² + 2(9.80)(9.90 − 8.00)) | 7.30 m/s |
| Minimum top speed | √(9.80 × 3.50) | 5.86 m/s |
| Ideal top normal force | 1.00(7.30²/3.50 − 9.80) | 5.4 N |
| Minimum release height from rest | ytop + r/2 | 9.75 m |
The block’s finite dimensions and the simulator’s contact geometry can shift a measured height or force slightly from this centerline model. Report the measured sample and the ideal prediction separately rather than silently replacing one with the other.
Worked example
Why the prepared run should keep contact
Using the centerline starting height of about 9.90 m and top height of 8.00 m:
vtop = √(4.00² + 2(9.80)(9.90 − 8.00))
vtop ≈ 7.30 m/s
That exceeds the 5.86 m/s contact threshold. Substituting the predicted speed into the top force equation gives:
Ntop = 1.00(7.30²/3.50 − 9.80) ≈ 5.4 N
The positive result predicts that the track is still pushing on the block at the top. If a trial’s normal force approaches zero, lower the launch condition and compare the first point where the block leaves the track with the calculated threshold.
Compare trials
Change speed or height, not both at once
At the prepared starting height, changing initial speed changes the available energy and the top contact margin. These are ideal centerline predictions for a 1 kg block; use them to plan trials.
| Initial speed (m/s) | Top speed (m/s) | Top normal force (N) | Prediction |
|---|---|---|---|
| 0.00 | 6.11 | 0.86 | Barely maintains contact |
| 2.00 | 6.43 | 2.02 | Maintains contact with a small margin |
| 4.00 | 7.30 | 5.43 | Baseline |
| 5.00 | 7.89 | 7.98 | Comfortable margin |
A second investigation starts from rest and changes release height. The ideal minimum centerline release height is 9.75 m for this 3.50 m loop. Starting lower can still let the block reach the top, but the top normal force becomes negative in the ideal equation, which signals that continuous contact is impossible.
Interpret the evidence
Use three graphs to tell the story
Plot speed against height to show the energy trade: speed falls as gravitational potential energy rises. Plot total mechanical energy against time to test the frictionless model. Plot normal force around the loop, especially at the top, to identify the contact threshold.
At the top, a normal-force value below zero is not a physical pulling force from the track. It means the block would have to leave the surface for that ideal circular-path equation to remain valid. After contact is lost, analyze the flight separately.
Common misconceptions
Check the reasoning
Is reaching the top enough?
No. The block must reach the top with at least √(gr) speed so the normal force can remain nonnegative.
Is centripetal force an extra force?
No. “Centripetal” describes the inward net-force requirement. At the top, weight and normal force together supply that requirement.
Is speed constant around the loop?
No. Gravity does negative work while the block rises and positive work while it falls. Speed is lowest near the top and greatest near the bottom in the ideal run.
Does zero normal force mean zero acceleration?
No. At the limiting top condition, gravity still supplies inward acceleration even though the track’s normal force is zero.
For teachers
Separate energy and force evidence
Have students make two predictions before running: an energy prediction for top speed and a force prediction for top normal force. Require them to label every table entry as calculated or measured. This makes the distinction between “can reach the top” and “stays in contact” visible.
For an extension, enable friction and assign nonzero coefficients to the track and block. Compare the fall in total mechanical energy with the shift in the minimum release condition. Then compare this experiment with Vertical Circular Motion, which uses a string, and Skater Bowl, which emphasizes energy without a closed loop.
Review Conservation of Energy and Newton’s Second Law. Physics reference: OpenStax, Physics, circular motion and centripetal force. Learn about the educator behind the simulations on the BuildPhysics About page.