
Plan the investigation
Where does the energy go?
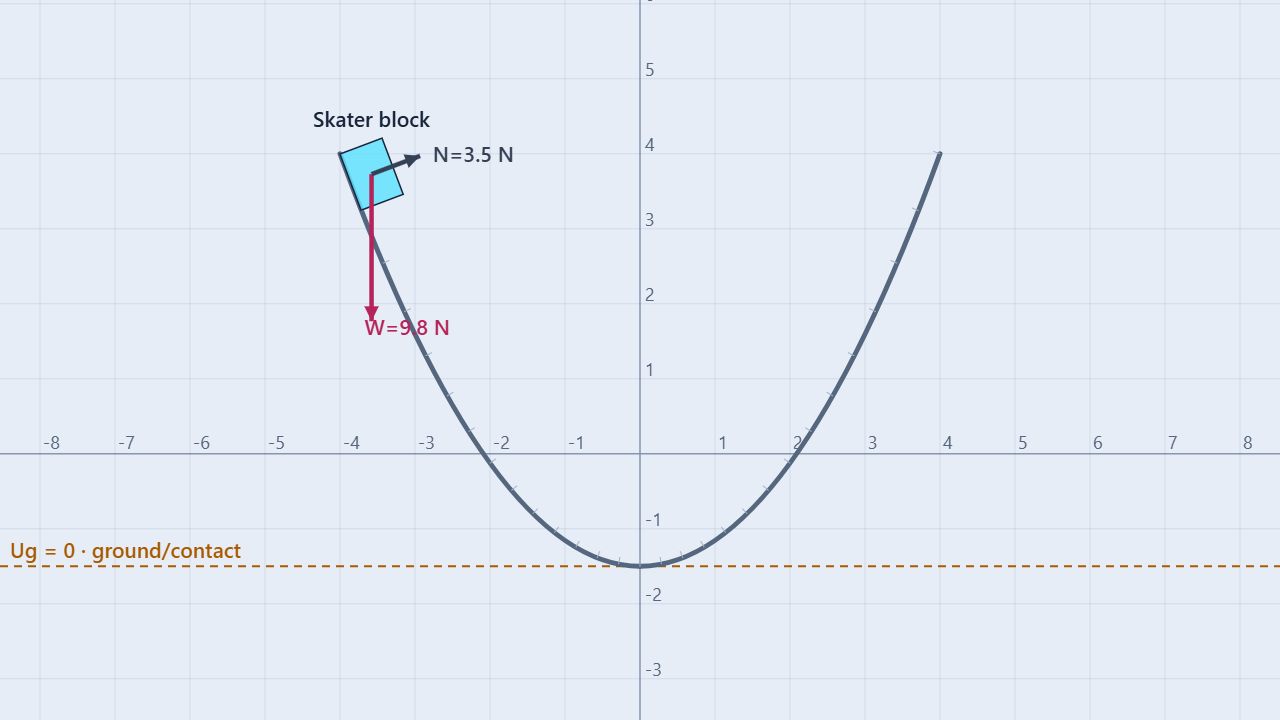
The prepared scene releases a 1 kg Skater block from rest on the left side of a curved bowl. Friction and drag are disabled, the bowl is stationary, and rotation is locked. The graphs show gravitational potential energy, kinetic energy, and their mechanical-energy sum.
Measure
Time, center height, speed, kinetic energy, potential energy, and total mechanical energy at different points along the first swing.
Keep fixed
Mass at 1 kg, gravity downward at 9.80 m/s², release position, zero initial velocity, and the prepared bowl geometry.
The preset places the potential-energy reference at y = −1.5 m. Use the block’s center height above that reference, h = y + 1.5 m. The block’s center is above the bowl surface, so reaching the lowest surface point does not necessarily mean Ug = 0.
Build the model
Predict speed from the drop in height
K = ½mv², Ug = mgh
Emech = K + Ug
½mvi² + mghi = ½mvf² + mghf
For release from rest, mass cancels and v = √(2gΔh), where Δh is the decrease in the block’s center height. The ideal normal force redirects motion without transferring energy because it is perpendicular to motion along a stationary, frictionless surface.
Procedure
A useful five-trial workflow
- Load and inspect. Launch the simulation and choose the Skater bowl experiment if a saved scene appears. Select Skater block. Keep friction and drag disabled and confirm zero initial velocity.
- Record the start. In Properties, record the block’s actual center y position and mass. Calculate its initial potential energy using the reference y = −1.5 m. Do not substitute the bowl rim’s height for the block center.
- Watch the exchange. Open the Data panel and run through the first descent and climb. Pause near the first turning point on the right. The preset’s graphs show Ug, K, and mechanical energy.
- Sample the first swing. Record five samples: near release, partway down, near the bottom, partway up, and near the opposite turning point. These five sampling trials describe one run, not five independent releases. Record the actual time and energy values for each.
- Check and repeat. Compare K + Ug across the samples, then reset and repeat to check consistency. Export CSV. Use center heights and speeds from corresponding times to check v² = 2gΔh.
The lowest point should have the greatest speed, while a turning point has nearly zero speed. In the ideal model, the block returns to its original center height on the opposite side. Record any difference rather than assuming perfect conservation in a numerical simulation.
| Center height loss (m) | K gained, 1 kg (J) | Speed (m/s) |
|---|---|---|
| 0.00 | 0.00 | 0.000 |
| 0.50 | 4.90 | 3.130 |
| 1.00 | 9.80 | 4.427 |
| 1.50 | 14.70 | 5.422 |
| 2.00 | 19.60 | 6.261 |
Worked example
A 1 kg block drops 2 m
Suppose a block released from rest drops 2.00 m in center height. This is an illustrative height difference, not a claim about a particular sampled position in the preset.
ΔUg = −mgΔh = −19.60 J
ΔK = +19.60 J
v = √(2 × 9.80 × 2.00) ≈ 6.261 m/s
A 2 kg block released through the same height difference would gain 39.20 J of kinetic energy but reach the same ideal speed. Doubling mass doubles both energy terms and leaves the speed prediction unchanged.
Interpret the evidence
Three graphs tell one story
During descent, Ug decreases while K increases. During ascent, K decreases while Ug increases. Their sum should stay approximately flat in the lossless model.
Compare each measured total E with the starting total E₀. Report E − E₀ in joules. With this preset’s nonzero starting energy, you can also report 100(E − E₀)/|E₀| as a percentage. Numerical integration and contact corrections can cause drift or abrupt changes; distinguish those from an intentional friction investigation.
Common misconception
Does conservation mean kinetic energy stays constant?
No. K and Ug change individually. Their sum is conserved under the stated assumptions.
Does changing the zero of potential energy change the motion?
No. A new reference adds a constant to potential energy and the total-energy value. Height differences and predicted speeds remain unchanged.
Is the block motionless at the bottom?
No. It moves fastest near the bottom. Its vertical velocity may be zero there while its horizontal velocity is large.
Does friction destroy energy?
No. Friction can transfer mechanical energy into thermal energy. K + Ug then decreases, although total energy remains conserved when the relevant thermal energy is included.
For teachers
Test the model with a second run
Repeat the same release with a 2 kg block. Compare speeds at equal center heights and the energy scales. Then test a different release position, starting from rest with the block properly supported by the bowl.
For a friction extension, enable friction and assign nonzero coefficients to the actual block–bowl contacts; the preset surfaces and block have zero coefficients. Merely enabling the global switch may leave the run frictionless. Record the return height and mechanical-energy change.
Continue with the Roller Coaster Loop experiment, where sufficient energy and continued contact are separate conditions. Review Conservation of Mechanical Energy. Physics reference: OpenStax, University Physics Volume 1, §8.3. Learn about the educator behind the simulations on the BuildPhysics About page.