
Plan the investigation
Classify the contact before calculating friction
Friction is a contact interaction between two surfaces. The coefficients belong to that surface pair, and the contact state determines which model applies:
0 ≤ fs ≤ μsFN
fk = μkFN
Static friction is whatever value prevents relative motion, up to its maximum. Kinetic friction acts after the surfaces slide and points opposite their relative motion. Do not substitute μsFN for static friction in every trial.
Change or control
Change the applied force, μs, μk, or the normal force one at a time. Keep the 4 kg block and level surface fixed when mapping the threshold.
Measure and compare
Record applied force, friction, net force, speed, and acceleration. Classify each run as sticking or sliding before choosing an equation.
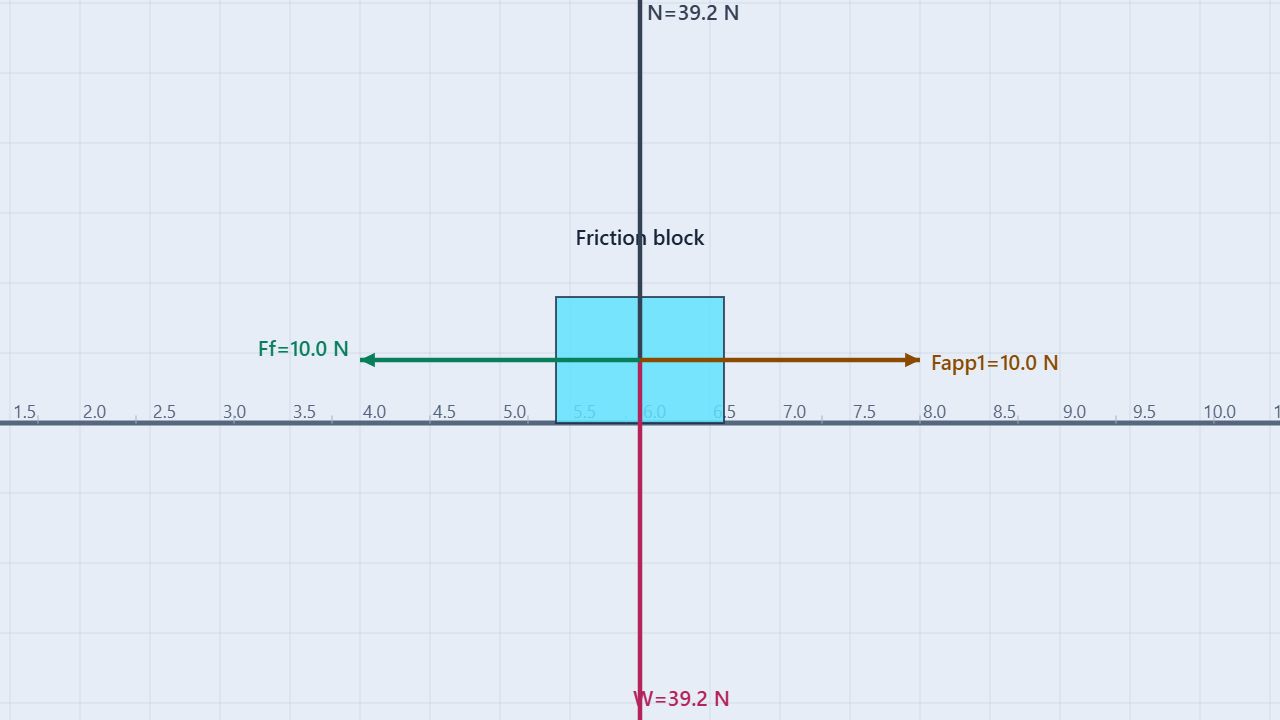
The prepared horizontal scene uses a 4 kg block, a surface with μs = 0.50 and μk = 0.30, and a 10 N force to the right. With no other vertical force, FN = mg = 39.2 N.
Find the threshold
Static friction adjusts until it runs out of range
For the prepared block, the largest possible static friction is:
fs,max = μsFN = (0.50)(39.2 N) = 19.6 N
A 10 N push requires only 10 N of friction, so the block does not move. An 18 N push still remains below the limit. A 22 N push exceeds the limit, so the surfaces begin sliding and the friction model changes.
| Applied force | Contact state | Friction | Net force | Acceleration |
|---|---|---|---|---|
| 0 N | Sticking | 0 N | 0 N | 0 m/s² |
| 10 N right | Sticking | 10 N left | 0 N | 0 m/s² |
| 18 N right | Sticking | 18 N left | 0 N | 0 m/s² |
| 22 N right | Sliding | 11.76 N left | 10.24 N right | 2.56 m/s² right |
| 11.76 N right while sliding | Sliding | 11.76 N left | 0 N | 0 m/s² |
Procedure
Map the transition from sticking to sliding
- Load and inspect. Launch the Static Versus Kinetic Friction simulation and keep the prepared 4 kg block. Confirm the level surface, μs = 0.50, μk = 0.30, and the 10 N applied force.
- Predict before running. Calculate FN and fs,max. Predict whether the current applied force is below the breakaway threshold.
- Choose evidence. Select the block, show force values, and graph applied force, friction, and net force. Keep the same run time and initial velocity for each horizontal trial.
- Run a static trial. Run the 10 N case, then repeat with 18 N. The block should remain at rest, friction should match the applied force in the opposite direction, and net force should remain near zero.
- Cross the limit. Reset and set the applied force to 22 N. Once the block is clearly sliding, read kinetic friction and compare it with μkFN = 11.76 N.
- Test constant-speed sliding. Give the block an initial rightward velocity and set the applied force to 11.76 N right. Equal horizontal forces should produce zero acceleration while the block keeps moving.
- Change the normal force. Add a 12 N downward force while the block slides. Recalculate FN and kinetic friction, then compare the new acceleration with the unpressed case.
- Reset between trials. Record the coefficient values, force settings, contact state, and a representative graph sample before changing the next variable.
Worked example
Calculate the sliding acceleration
After a 22 N push starts the 4 kg block sliding, use kinetic friction rather than the static limit:
fk = μkFN = (0.30)(39.2 N) = 11.76 N left
ΣFx = 22 N − 11.76 N = 10.24 N right
ax = ΣFx/m = 10.24 N / 4.0 kg = 2.56 m/s² right
Now press downward with 12 N while the block slides. The normal force becomes 39.2 N + 12 N = 51.2 N, so:
fk = (0.30)(51.2 N) = 15.36 N
The block’s speed alone did not cause the increase. The downward force increased the normal force, which increased the friction magnitude.
Read the graphs
Use the friction trace to identify the contact state
In a force-versus-time or force-versus-sample graph, static friction rises with the applied force while the block remains at rest. It stops at μsFN. After breakaway, the kinetic-friction trace drops to the lower value μkFN and stays approximately constant while the surface and normal force stay fixed.
Sticking
Applied force and static friction have equal magnitudes, net force is near zero, and speed does not change.
Sliding
Kinetic friction opposes relative motion. The difference between applied force and friction determines net force and acceleration.
Use the acceleration trace as a check, not as the definition of friction. Zero acceleration can mean rest with balanced static friction, or constant-speed motion with balanced kinetic friction.
Normal force and surfaces
Friction depends on contact pressure and material pairing
On a level surface with no other vertical force, FN = mg. A downward push raises FN; an upward pull lowers it and can eventually remove contact. On an incline, use the perpendicular weight component, usually FN = mg cosθ, before calculating a friction limit.
The coefficients describe the pair of contacting materials. Changing the block or the surface can change μs and μk. They are not properties of the block alone.
Extension: rough incline
Apply the same decision process on a ramp
For a 4 kg block on a 20° ramp with the same μs = 0.50:
FN = mg cos20° ≈ 36.84 N
mg sin20° ≈ 13.41 N down the ramp
fs,max = (0.50)(36.84 N) ≈ 18.42 N
Because the downhill component is below the static limit, actual static friction is about 13.41 N up the ramp and acceleration is zero. At the critical angle, the required friction reaches its limit:
mg sinθc = μsmg cosθc
tanθc = μs
For μs = 0.50, θc ≈ 26.6°. Mass changes the force magnitudes but cancels from the ideal critical-angle relationship.
Common misconceptions
Check the reasoning
Is static friction always μsFN?
No. That expression is the maximum possible value. Actual static friction adjusts from zero to that limit as needed.
Does contact guarantee a nonzero friction force?
No. With no attempted relative motion, static friction can be zero.
Does friction always point opposite the object’s velocity?
Friction opposes relative sliding or attempted sliding at the contact. Identify the motion of the surfaces relative to each other.
Does a moving object always have nonzero acceleration?
No. A moving block can have zero acceleration when an applied force balances kinetic friction.
Are mg sinθ and mg cosθ extra forces?
No. They are components of the one weight vector. Use either the full vector or its components consistently.
For teachers
Make students predict the contact state
Begin with 0 N, 10 N, and 18 N pushes. Ask students for the actual friction before showing the maximum, then use 22 N to force a clear transition to kinetic friction. Have them label the graph at the instant of breakaway.
Use the constant-speed trial to separate motion from acceleration, then add the 12 N downward force to show why friction changes when the normal force changes. Finish on the incline by requiring students to compare the required static friction with its maximum before deciding whether the block moves.
Continue with Static and Kinetic Friction for the full concept guide, Free-Body Diagrams for force selection, and the Critical-Angle Friction experiment for threshold measurements on a ramp.